


1、前言
https://windrose.readthedocs.io/en/latest/usage.html
2、数据处理
导入模块
 1%matplotlib inline
 2import pandas as pd
 3import numpy as np
 4from matplotlib import pyplot as plt
 5import matplotlib.cm as cm
 6from math import pi
 7import windrose
 8from windrose import WindroseAxes, WindAxes, plot_windrose
 9from mpl_toolkits.axes_grid1.inset_locator import inset_axes
10import cartopy.crs as ccrs
11import cartopy.io.img_tiles as cimgt
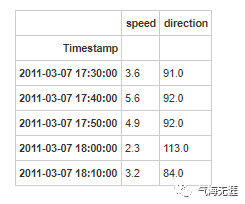
读取数据
1df = pd.read_csv("/home/kesci/work/data/sample_wind_poitiers.csv", parse_dates=['Timestamp'])
2df = df.set_index('Timestamp')
3df.head(5)
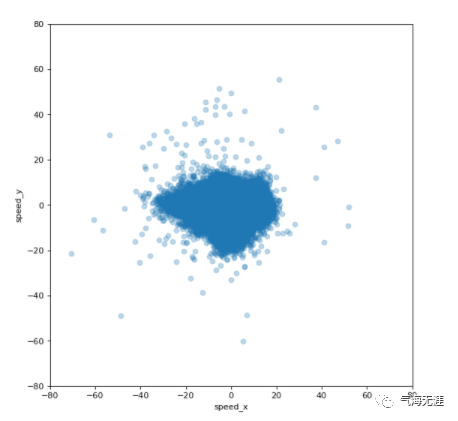
计算风速的u、v分量
1df['speed_x'] = df['speed'] * np.sin(df['direction'] * pi / 180.0)
2df['speed_y'] = df['speed'] * np.cos(df['direction'] * pi / 180.0)
3、绘图
 1fig, ax = plt.subplots(figsize=(8, 8), dpi=80)
 2x0, x1 = ax.get_xlim()
 3y0, y1 = ax.get_ylim()
 4ax.set_aspect(abs(x1-x0)/abs(y1-y0))
 5ax.set_aspect('equal')
 6ax.scatter(df['speed_x'], df['speed_y'], alpha=0.25)
 7df.plot(kind='scatter', x='speed_x', y='speed_y', alpha=0.05, ax=ax)
 8Vw = 80
 9ax.set_xlim([-Vw, Vw])
10ax.set_ylim([-Vw, Vw])
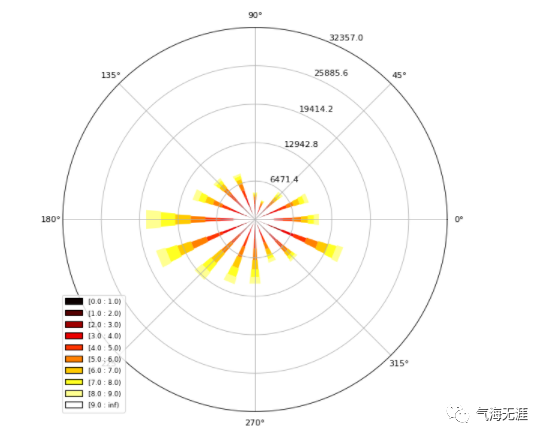
2. 风玫瑰图--形式1
1ax = WindroseAxes.from_ax()
2ax.bar(df.direction.values, df.speed.values, bins=np.arange(0.01,10,1), cmap=cm.hot, lw=3)
3ax.set_legend()

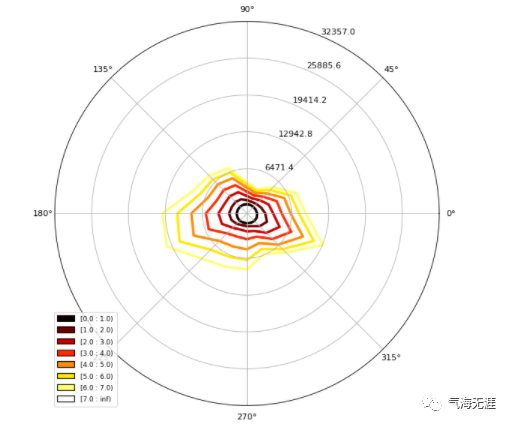
3. 风玫瑰图--形式2
1ax = WindroseAxes.from_ax()
2ax.box(df.direction.values, df.speed.values, bins=np.arange(0.01,10,1), cmap=cm.hot, lw=3)
3ax.set_legend()
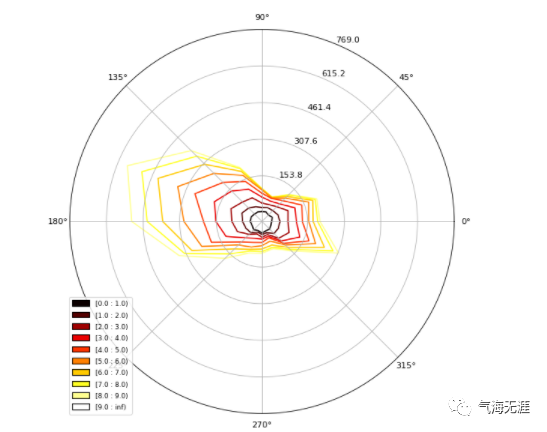
4. 风玫瑰图--形式3
1plot_windrose(df, kind='contour', bins=np.arange(0.01,8,1), cmap=cm.hot, lw=3)
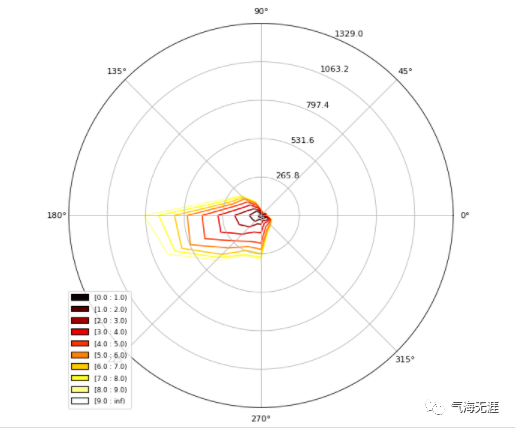
5. 绘制特定月份风玫瑰图
1def plot_month(df, t_year_month, *args, **kwargs):
2    by = 'year_month'
3    df[by] = df.index.map(lambda dt: (dt.year, dt.month))
4    df_month = df[df[by] == t_year_month]
5    ax = plot_windrose(df_month, *args, **kwargs)
6    return ax
7
8plot_month(df, (2014, 7), kind='contour', bins=np.arange(0, 10, 1), cmap=cm.hot)
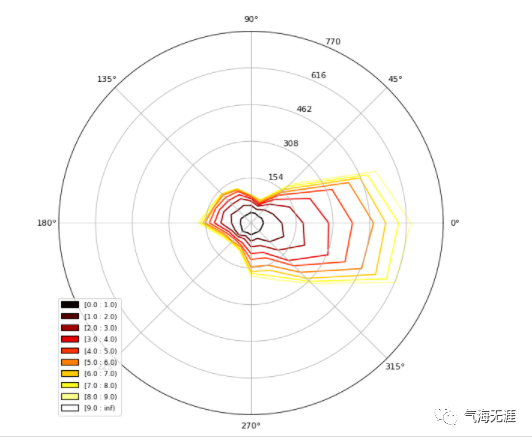
1plot_month(df, (2014, 8), kind='contour', bins=np.arange(0, 10, 1), cmap=cm.hot)
1plot_month(df, (2014, 9), kind='contour', bins=np.arange(0, 10, 1), cmap=cm.hot)
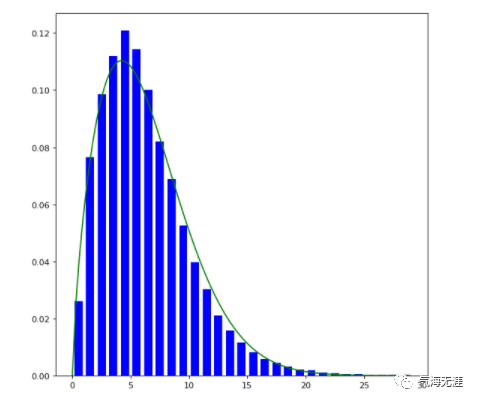
6. 绘制风速频率直方图
1bins = np.arange(0,30+1,1)
2bins = bins[1:]
3bins
1array([ 1,  2,  3,  4,  5,  6,  7,  8,  9, 10, 11, 12, 13, 14, 15, 16, 17,
2       18, 19, 20, 21, 22, 23, 24, 25, 26, 27, 28, 29, 30])
1plot_windrose(df, kind='pdf', bins=np.arange(0.01,30,1),normed=True)
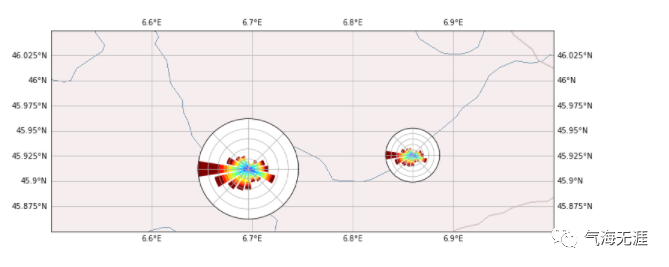
7. 在地图上绘制风玫瑰图
1data = np.histogram(df['speed'], bins=bins)[0]
2data
1array([15377, 20041, 23987, 24356, 24041, 21238, 18007, 14144, 11328,
2        8461,  6551,  4625,  3265,  2523,  1749,  1294,   922,   686,
3         463,   362,   267,   195,   128,   117,    77,    52,    52,
4          40,    29])
 1proj = ccrs.PlateCarree()
 2
 3fig = plt.figure(figsize=(12, 6))
 4minlon, maxlon, minlat, maxlat = (6.5, 7.0, 45.85, 46.05)
 5
 6main_ax = fig.add_subplot(1, 1, 1, projection=proj)
 7main_ax.set_extent([minlon, maxlon, minlat, maxlat], crs=proj)
 8main_ax.gridlines(draw_labels=True)
 9
10main_ax.add_wms(wms='http://vmap0.tiles.osgeo.org/wms/vmap0',layers=['basic'])
11
12cham_lon, cham_lat = (6.8599, 45.9259)
13passy_lon, passy_lat = (6.7, 45.9159)
14
15
16
17wrax_cham = inset_axes(main_ax,
18        width=1,
19        height=1,
20        loc='center',
21        bbox_to_anchor=(cham_lon, cham_lat),
22        bbox_transform=main_ax.transData,
23        axes_class=windrose.WindroseAxes,
24        )
25
26
27height_deg = 0.1
28wrax_passy = inset_axes(main_ax,
29        width="100%",
30        height="100%",
31        bbox_to_anchor=(passy_lon-height_deg/2, passy_lat-height_deg/2, height_deg, height_deg),
32        bbox_transform=main_ax.transData,
33        axes_class=windrose.WindroseAxes,
34        )
35
36wrax_cham.bar(df.direction.values, df.speed.values,bins=np.arange(0.01,10,1), lw=3)
37wrax_passy.bar(df.direction.values, df.speed.values,bins=np.arange(0.01,10,1), lw=3)
38
39for ax in [wrax_cham, wrax_passy]:
40        ax.tick_params(labelleft=False, labelbottom=False)
有问题可以到QQ群里进行讨论,我们在那边等大家。
QQ群号:854684131
文章转载自气海无涯,如果涉嫌侵权,请发送邮件至:contact@modb.pro进行举报,并提供相关证据,一经查实,墨天轮将立刻删除相关内容。
