


1、前言
1http://tcdata.typhoon.org.cn/
本示例读取数据为2018年的台风,已经将原始的txt文件转换为xls文件。
2、读取台风路径数据
导入模块
 1import os
 2import pandas as pd
 3import shapely.geometry as sgeom
 4import matplotlib.pyplot as plt
 5from matplotlib.image import imread
 6from matplotlib.animation import FuncAnimation
 7import matplotlib.lines as mlines
 8import cartopy.crs as ccrs
 9import cartopy.feature as cfeat
10from cartopy.mpl.gridliner import LONGITUDE_FORMATTER, LATITUDE_FORMATTER
11import cartopy.io.shapereader as shpreader
12from PIL import Image
13import warnings
14warnings.filterwarnings('ignore')
15import cartopy.io.img_tiles as cimgt
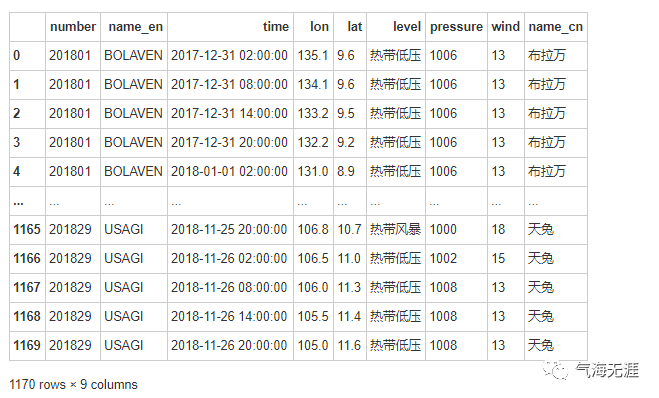
读取数据,包含台风编号、台风中英文名称、经纬度信息、台风强度、中心最低气压
1df = pd.read_excel('/home/kesci/work/data/2018.xls')
2df
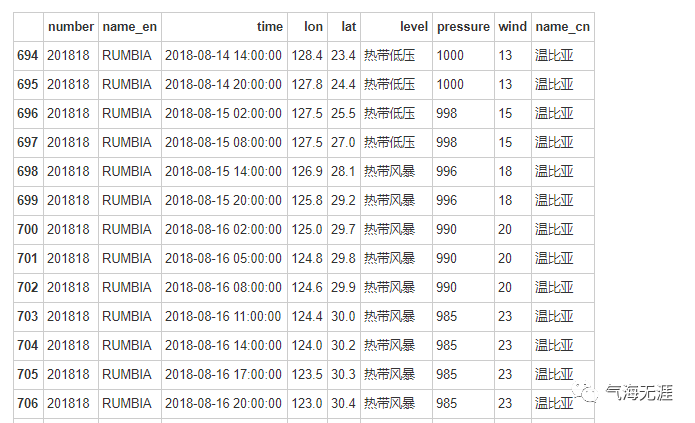
筛选数据
1df = df[df['number']==201818]
2df
显示路径图
1track = sgeom.LineString(zip(df['lon'], df['lat']))
2track

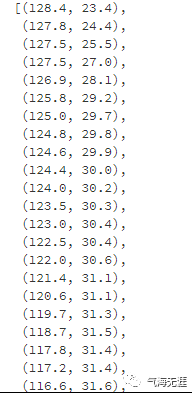
获取轨迹点
1track.coords[:]
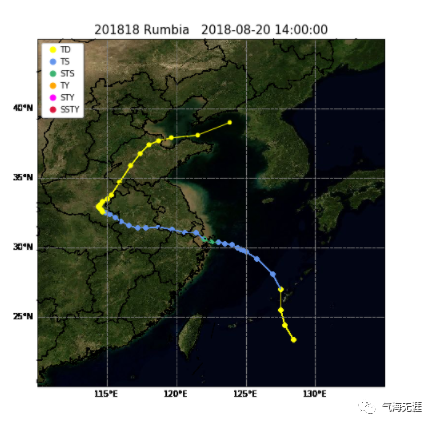
3、绘制单个台风路径图
分级设置颜色
 1def get_color(level):
 2    global color
 3    if level == '热带低压' or level == '热带扰动':
 4        color='#FFFF00'
 5    elif level == '热带风暴':
 6        color='#6495ED'
 7    elif level == '强热带风暴':
 8        color='#3CB371'
 9    elif level == '台风':
10        color='#FFA500'
11    elif level == '强台风':
12        color='#FF00FF'
13    elif level == '超强台风':
14        color='#DC143C'
15    return color
1fig = plt.figure(figsize=(12, 8))
2ax = fig.add_subplot(1, 1, 1, projection=ccrs.PlateCarree())
3url = 'http://map1c.vis.earthdata.nasa.gov/wmts-geo/wmts.cgi'
4layer = 'BlueMarble_ShadedRelief'
5ax.add_wmts(url, layer)
6ax.set_extent([110, 135, 20, 45],crs=ccrs.PlateCarree())
7
8for i in range(len(df)):
9 ax.scatter(list(df['lon'])[i], list(df['lat'])[i], marker='o', s=20, color=get_color(list(df['level'])[i]))
10
11for i in range(len(df)-1):
12 pointA = list(df['lon'])[i],list(df['lat'])[i]
13 pointB = list(df['lon'])[i+1],list(df['lat'])[i+1]
14 ax.add_geometries([sgeom.LineString([pointA, pointB])], color=get_color(list(df['level'])[i+1]),crs=ccrs.PlateCarree())
15
16
17gl = ax.gridlines(auto_inline=False, draw_labels=True, linewidth=1, color='k', alpha=0.5, linestyle='--')
18gl.xlabels_top = False #关闭顶端标签
19gl.ylabels_right = False #关闭右侧标签
20gl.xformatter = LONGITUDE_FORMATTER #x轴设为经度格式
21gl.yformatter = LATITUDE_FORMATTER #y轴设为纬度格式
22
23a = mlines.Line2D([],[],color='#FFFF00',marker='o',markersize=7, label='TD',ls='')
24b = mlines.Line2D([],[],color='#6495ED', marker='o',markersize=7, label='TS',ls='')
25c = mlines.Line2D([],[],color='#3CB371', marker='o',markersize=7, label='STS',ls='')
26d = mlines.Line2D([],[],color='#FFA500', marker='o',markersize=7, label='TY',ls='')
27e = mlines.Line2D([],[],color='#FF00FF', marker='o',markersize=7, label='STY',ls='')
28f = mlines.Line2D([],[],color='#DC143C', marker='o',markersize=7, label='SSTY',ls='')
29ax.legend(handles=[a,b,c,d,e,f], numpoints=1, handletextpad=0, loc='upper left', shadow=True)
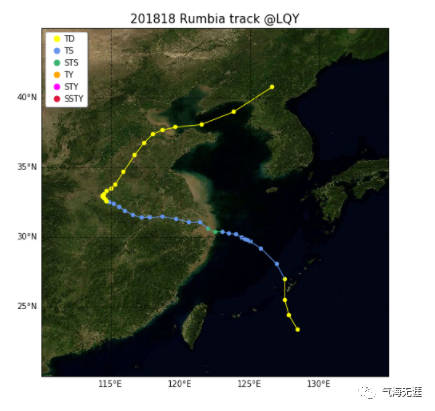
30plt.title('201818 Rumbia track @LQY',fontsize=15)
31plt.show()
4、台风路径动态可视化
 1fig = plt.figure(figsize=(12, 8))
 2ax = fig.add_subplot(1, 1, 1, projection=ccrs.PlateCarree())
 3url = 'http://map1c.vis.earthdata.nasa.gov/wmts-geo/wmts.cgi'
 4layer = 'BlueMarble_ShadedRelief'
 5ax.add_wmts(url, layer)
 6
 7ax.set_extent([110, 135, 20, 45],crs=ccrs.PlateCarree())
 8
 9for state in range(len(df.index)):
10    for i in range(len(df[:state])):
11        ax.scatter(list(df['lon'])[i], list(df['lat'])[i], marker='o', s=20, color=get_color(list(df['level'])[i]))
12
13    for i in range(len(df[:state])-1):
14        pointA = list(df['lon'])[i],list(df['lat'])[i]
15        pointB = list(df['lon'])[i+1],list(df['lat'])[i+1]
16        ax.add_geometries([sgeom.LineString([pointA, pointB])], color=get_color(list(df['level'])[i+1]),crs=ccrs.PlateCarree())
17
18    # 添加国界和九段线
19    province = shpreader.Reader('/home/kesci/work/province.shp')
20    nineline = shpreader.Reader('/home/kesci/work/nine_line.shp')
21    ax.add_geometries(province.geometries(), crs=ccrs.PlateCarree(), linewidths=0.2,edgecolor='k',facecolor='none')
22    ax.add_geometries(nineline.geometries(), crs=ccrs.PlateCarree(),linewidths=0.2, color='k')
23
24    gl = ax.gridlines(auto_inline=False, draw_labels=True, linewidth=1, color='grey', alpha=0.5, linestyle='--')
25    gl.xlabels_top = False  #关闭顶端标签
26    gl.ylabels_right = False  #关闭右侧标签
27    gl.xformatter = LONGITUDE_FORMATTER  #x轴设为经度格式
28    gl.yformatter = LATITUDE_FORMATTER  #y轴设为纬度格式
29
30    a = mlines.Line2D([],[],color='#FFFF00',marker='o',markersize=7, label='TD',ls='')
31    b = mlines.Line2D([],[],color='#6495ED', marker='o',markersize=7, label='TS',ls='')
32    c = mlines.Line2D([],[],color='#3CB371', marker='o',markersize=7, label='STS',ls='')
33    d = mlines.Line2D([],[],color='#FFA500', marker='o',markersize=7, label='TY',ls='')
34    e = mlines.Line2D([],[],color='#FF00FF', marker='o',markersize=7, label='STY',ls='')
35    f = mlines.Line2D([],[],color='#DC143C', marker='o',markersize=7, label='SSTY',ls='')
36    ax.legend(handles=[a,b,c,d,e,f], numpoints=1, handletextpad=0, loc='upper left', shadow=True)
37    plt.title('201818 Rumbia   ' + list(df['time'])[i],fontsize=15)
38    plt.savefig(str(state)+'.png', bbox_inches ='tight')
39    print(state)
 10
 21
 32
 43
 54
 65
 76
 87
 98
109
1110
1211
1312
1413
1514
1615
1716
1817
1918
2019
2120
2221
2322
2423
2524
2625
2726
2827
2928
3029
3130
3231
3332
3433
3534
3635
3736
3837
3938
4039
4140
4241
4342
4443
1imgFiles = [fn for fn in os.listdir('.') if fn.endswith('.png')]
2imgFiles.sort(key=lambda x:int(x[:-4]))
3print(imgFiles)
4images = [Image.open(fn) for fn in imgFiles]
5im = images[0]
6filename = 'test.gif'
7im.save(fp=filename, format='gif', save_all=True, append_images=images[1:], duration=500)
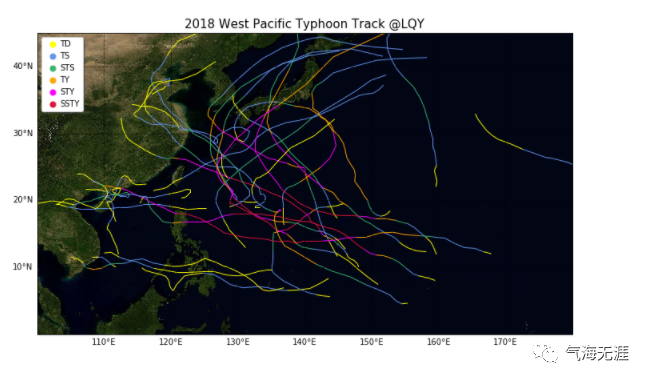
5、绘制多个台风路径图
读取数据
1import pandas as pd
2df = pd.read_excel('2018.xls')
获得台风编号列表
1L = list(set(df['number']))
2L.sort(key=list(df['number']).index)
3L
输出:
 1[201801,
 2 201802,
 3 201803,
 4 201804,
 5 201805,
 6 201806,
 7 201807,
 8 201808,
 9 201809,
10 201810,
11 201811,
12 201812,
13 201813,
14 201814,
15 201815,
16 201816,
17 201817,
18 201818,
19 201819,
20 201820,
21 201821,
22 201822,
23 201823,
24 201824,
25 201825,
26 201826,
27 201827,
28 201828,
29 201829]
绘图:
 1fig = plt.figure(figsize=(12, 8))
 2ax = fig.add_subplot(1, 1, 1, projection=ccrs.PlateCarree())
 3url = 'http://map1c.vis.earthdata.nasa.gov/wmts-geo/wmts.cgi'
 4layer = 'BlueMarble_ShadedRelief'
 5ax.add_wmts(url, layer)
 6ax.set_extent([100, 180, 0, 45],crs=ccrs.PlateCarree())
 7for number in L:
 8    df1 = df[df['number']==number]
 9    for i in range(len(df1)-1):
10        pointA = list(df1['lon'])[i],list(df1['lat'])[i]
11        pointB = list(df1['lon'])[i+1],list(df1['lat'])[i+1]
12        ax.add_geometries([sgeom.LineString([pointA, pointB])], color=get_color(list(df1['level'])[i+1]),crs=ccrs.PlateCarree())
13
14gl = ax.gridlines(auto_inline=False, draw_labels=True, linewidth=1, color='k', alpha=0.5, linestyle='--')
15gl.xlabels_top = False  #关闭顶端标签
16gl.ylabels_right = False  #关闭右侧标签
17gl.xformatter = LONGITUDE_FORMATTER  #x轴设为经度格式
18gl.yformatter = LATITUDE_FORMATTER  #y轴设为纬度格式
19
20import matplotlib.lines as mlines
21a = mlines.Line2D([],[],color='#FFFF00',marker='o',markersize=7, label='TD',ls='')
22b = mlines.Line2D([],[],color='#6495ED', marker='o',markersize=7, label='TS',ls='')
23c = mlines.Line2D([],[],color='#3CB371', marker='o',markersize=7, label='STS',ls='')
24d = mlines.Line2D([],[],color='#FFA500', marker='o',markersize=7, label='TY',ls='')
25e = mlines.Line2D([],[],color='#FF00FF', marker='o',markersize=7, label='STY',ls='')
26f = mlines.Line2D([],[],color='#DC143C', marker='o',markersize=7, label='SSTY',ls='')
27ax.legend(handles=[a,b,c,d,e,f], numpoints=1, handletextpad=0, loc='upper left', shadow=True)
28plt.title('2018 West Pacific Typhoon Track @LQY',fontsize=15)
29plt.show()
有问题可以到QQ群里进行讨论,我们在那边等大家。
QQ群号:854684131
文章转载自气海无涯,如果涉嫌侵权,请发送邮件至:contact@modb.pro进行举报,并提供相关证据,一经查实,墨天轮将立刻删除相关内容。
