



不积跬步,无以至千里;不积小流,无以成江海!
上一篇文章介绍了断路器的使用,本篇文章介绍断路器的可视化界面:
创建项目(hystrix-dasboard):
pom依赖:
<dependency><groupId>org.springframework.cloud</groupId><artifactId>spring-cloud-starter-netflix-hystrix-dashboard</artifactId></dependency><dependency><groupId>org.springframework.cloud</groupId><artifactId>spring-cloud-starter-netflix-eureka-client</artifactId></dependency>
APP启动类:
package org.chao.sc.hystrixdashboard;import org.springframework.boot.SpringApplication;import org.springframework.boot.autoconfigure.SpringBootApplication;import org.springframework.cloud.netflix.hystrix.dashboard.EnableHystrixDashboard;@SpringBootApplication@EnableHystrixDashboardpublic class HystrixDashboardApplication {public static void main(String[] args) {SpringApplication.run(HystrixDashboardApplication.class, args);}}
@EnableHystrixDashboard 注解必须声明。
bootstrap.yml配置文件:
spring:application:name: hystrix-dashboardserver:port: 9000
启动项目 访问http://localhost:9000/hystrix
界面展示:
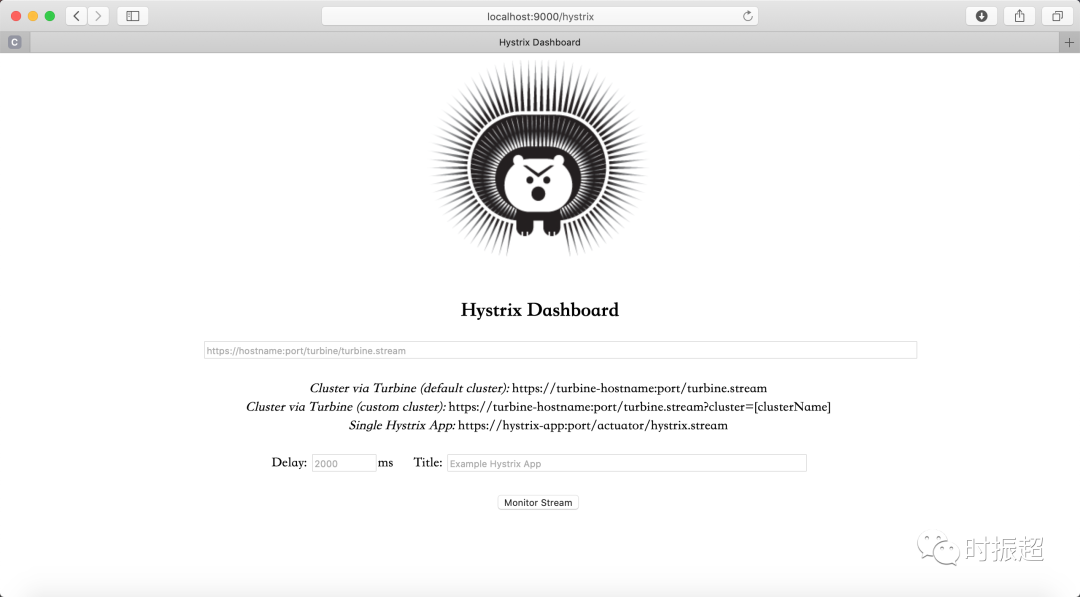
ui已经展现 那么数据如何收集并展示呢?
我们在地址中填写项目client1的监控地址(http://localhost:7002/actuator/hystrix.stream),点击monitor按钮:
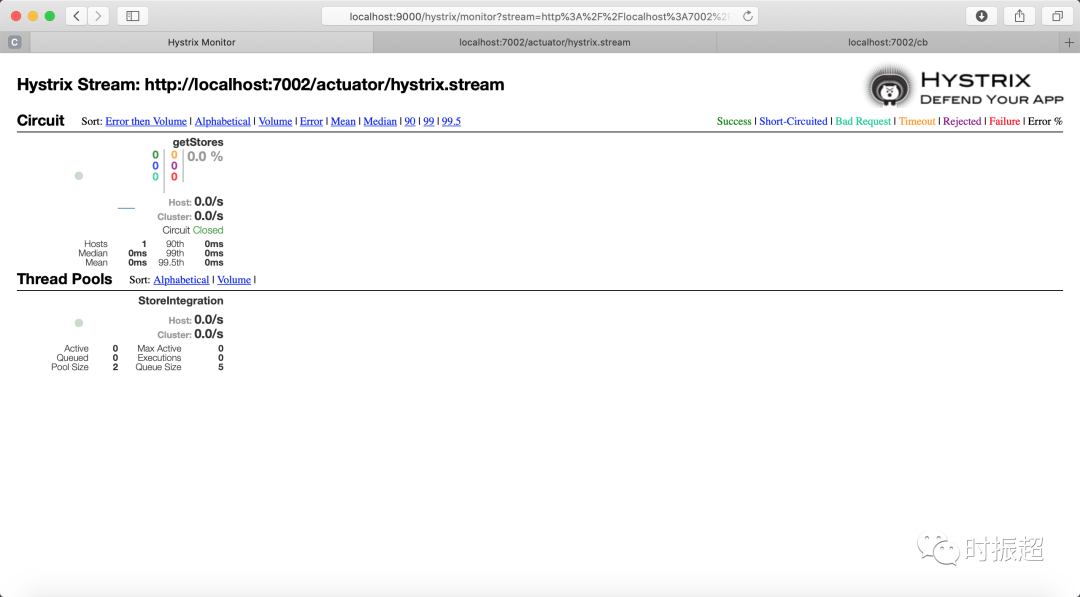
具体面板参数什么意思,我这里不做讲解。请去官网具体查看,或者去其他博客学习。
虽然有面板查看了,但是我一个服务可能有多个实例。我不能一个一个去输入地址查看面板,有没有什么办法去统一收集数据,查询监控呢。
下一章将讲解turbine,来收取多个服务的数据,统一展现在dashboard上。
文章转载自时振超,如果涉嫌侵权,请发送邮件至:contact@modb.pro进行举报,并提供相关证据,一经查实,墨天轮将立刻删除相关内容。
