OceanBase企业版中,已经提供了OceanBase云平台(OceanBase Cloud Platform,OCP)对OB集群进行管理、监控等,社区版2021年10月份提供了OBAgent进行信息收集,可将ob信息推送至prometheus,在2021年11月中旬提供了grafana监控面板,可将prometheus的监控数据在grafana上进行展示。
2021年12月31日推出了社区版OCP,支持使用OCP部署Oceanbase-ce 3.1.2,但该版本目前不支持OBD部署的OceanBase集群接管,OCP下个迭代版本会考虑支持,计划 2 月份。
上篇(1/2)详见:
2. 安装prometheus
1) 介质下载
下载页面:
https://prometheus.io/download/
也可直接下载:
wget https://github.com/prometheus/prometheus/releases/download/v2.32.1/prometheus-2.32.1.linux-amd64.tar.gz
2) 安装GO语言
prometheus及相关组件如node_exporter、mysqld_exporter都是GO语言开发,需要先安装golang。
# wget -O /etc/yum.repos.d/epel.repo http://mirrors.aliyun.com/repo/epel-7.repo# yum -y install go# go versiongo version go1.15.14 linux/amd64
3) 安装prometheus
a.二进制版,解压即用
# mkdir /monitor #生产环境提前准备好监控部署目录# tar zxvf prometheus-2.32.1.linux-amd64.tar.gz -C /monitor/
b.创建软连接,便于管理
# ln -sv /monitor/prometheus-2.32.1.linux-amd64/ /monitor/prometheus
c.创建prometheus用户和组
# groupadd -g 3434 prometheus# useradd -u 3434 -g 3434 -s /sbin/nologin -M prometheus
d.创建prometheus数据目录
# mkdir /monitor/prometheus/data# chown -R prometheus:prometheus /monitor/prometheus/data# chown -R prometheus:prometheus /monitor/prometheus
e.配置prometheus服务
# vim /usr/lib/systemd/system/prometheus.service #添加如下内容[Unit]Description=prometheusAfter=network.target[Service]Type=simpleUser=prometheusExecStart=/monitor/prometheus/prometheus \--config.file=/monitor/prometheus/prometheus.yml \--storage.tsdb.path=/monitor/prometheus/data \--storage.tsdb.retention=15d \--web.read-timeout=5m \--web.max-connections=10 \--query.max-concurrency=20 \--query.timeout=2m \--web.enable-lifecycle \--web.enable-admin-apiRestart=on-failure[Install]WantedBy=multi-user.target
f.参数解释
--config.file=/monitor/prometheus/prometheus.yml #prometheus配置文件--storage.tsdb.path=/var/lib/prometheus #prometheus 存储数据路径--storage.tsdb.retention=15d #prometheus采集数据保留时间,15天--web.read-timeout=5m #请求链接的最大等待时间,5分钟--web.max-connections=10 #最大链接数,10个链接--query.max-concurrency=20 #最大支持的并发查询量--query.timeout=2m #单个查询超时时间,2分钟--web.enable-lifecycle #热加载--web.enable-admin-api #可以删除时序数据
g.启动prometheus
[root@monitor ~]# systemctl enable prometheus[root@monitor ~]# systemctl start prometheus
h.查看端口已启用
[root@monitor ~]# netstat -anlptu | grep :9090
i.访问Prometheus的web界面
http://192.168.80.110:9090
3. 使用OBAgent配置Prometheus
3.1 使用OBAgent配置文件
使用OBD部署OBAgent 会自动生成一份Prometheus配置文件,我们要把目标机器上的配置文件复制到中控机器。
# 配置文件路径
$ obagent_working_directory/conf/prometheus_config/prometheus.yaml
本次配置文件:
/home/admin/obagent/1/conf/prometheus_config/prometheus.yaml
3个目录的配置文件内容相同,使用任何一个均可。
备份原有配置
cp /monitor/prometheus/prometheus.yml /monitor/prometheus/prometheus.yml.orig
将OBAgent配置替换原有prometheus配置
cat /home/admin/obagent/1/conf/prometheus_config/prometheus.yaml > /monitor/prometheus/prometheus.yml
热加载配置
curl -XPOST http://localhost:9090/-/reload
3.2 查看监控指标
可以通过命令查看OBAgent的监控指标,也可以通过浏览器打开prometheus的监控项,下面使用命令查看主机、数据库的部分监控内容。
1) 查看主机指标
[admin@ob3 ~]$ curl --user admin:rundba http://192.168.80.110:8088/metrics/node/host | more% Total % Received % Xferd Average Speed Time Time Time CurrentDload Upload Total Spent Left Speed100 26921 0 26921 0 0# HELP node_cpu_seconds_total monitor collected metric2# TYPE node_cpu_seconds_total counter64k node_cpu_seconds_total{app="HOST",cpu="0",mode="idle",svr_ip="127.0.0.1"} 39456.150 --:node_cpu_seconds_total{app="HOST",cpu="0",mode="iowait",svr_ip="127.0.0.1"} 28.2--:-- -node_cpu_seconds_total{app="HOST",cpu="0",mode="irq",svr_ip="127.0.0.1"} 0-:--:--node_cpu_seconds_total{app="HOST",cpu="0",mode="nice",svr_ip="127.0.0.1"} 0.01--:--:node_cpu_seconds_total{app="HOST",cpu="0",mode="softirq",svr_ip="127.0.0.1"} 913.81-- 26node_cpu_seconds_total{app="HOST",cpu="0",mode="steal",svr_ip="127.0.0.1"} 0 5k....
2) 再查看ob基本指标
[admin@ob3 ~]$ curl --user admin:rundba http://192.168.80.110:8088/metrics/ob/basic | head% Total % Received % Xferd Average Speed Time Time Time CurrentDload Upload Total Spent Left Speed0 0 0 0 0 0 0 0 --:--:-- --:--:-- --:--:-- 0# HELP ob_active_session_num monitor collected metric# TYPE ob_active_session_num untypedob_active_session_num{app="OB",ob_cluster_id="1",ob_cluster_name="rundba",obzone="zone1",svr_ip="127.0.0.1",tenant_name="mysql_t1"} 0ob_active_session_num{app="OB",ob_cluster_id="1",ob_cluster_name="rundba",obzone="zone1",svr_ip="127.0.0.1",tenant_name="sys"} 7# HELP ob_cache_size_bytes monitor collected metric# TYPE ob_cache_size_bytes untypedob_cache_size_bytes{app="OB",cache_name="bf_cache",ob_cluster_id="1",ob_cluster_name="rundba",obzone="zone1",svr_ip="127.0.0.1",tenant_name="mysql_t1"} 4.193216e+06ob_cache_size_bytes{app="OB",cache_name="bf_cache",ob_cluster_id="1",ob_cluster_name="rundba",obzone="zone1",svr_ip="127.0.0.1",tenant_name="sys"} 6.290304e+06ob_cache_size_bytes{app="OB",cache_name="block_index_cache",ob_cluster_id="1",ob_cluster_name="rundba",obzone="zone1",svr_ip="127.0.0.1",tenant_name="mysql_t1"} 6.290304e+06ob_cache_size_bytes{app="OB",cache_name="block_index_cache",ob_cluster_id="1",ob_cluster_name="rundba",obzone="zone1",svr_ip="127.0.0.1",tenant_name="sys"} 6.290304e+06...
如果提示:404 page not found,需要确认数据库用户名和口令,如果错误,需在配置文件中修改:
[admin@ob3 ~]$ obd cluster edit-config rundba[admin@ob3 ~]$ obd cluster reload rundba[admin@ob3 ~]$ obd cluster restart obagent
再次查看指标已经存在。
3) 查看指定指标
[admin@ob3 ~]$ curl --user admin:rundba http://192.168.80.110:8088/metrics/ob/basic | grep ob_cache_size_bytes% Total % Received % Xferd Average Speed Time Time Time CurrentDload Upload Total Spent Left Speed0 0 0 0 0 0 0 0 --:--:-- --:--:-- --:--:-- 0# HELP ob_cache_size_bytes monitor collected metric# TYPE ob_cache_size_bytes untypedob_cache_size_bytes{app="OB",cache_name="bf_cache",ob_cluster_id="1",ob_cluster_name="rundba",obzone="zone1",svr_ip="127.0.0.1",tenant_name="mysql_t1"} 4.193216e+06ob_cache_size_bytes{app="OB",cache_name="bf_cache",ob_cluster_id="1",ob_cluster_name="rundba",obzone="zone1",svr_ip="127.0.0.1",tenant_name="sys"} 6.290304e+06ob_cache_size_bytes{app="OB",cache_name="block_index_cache",ob_cluster_id="1",ob_cluster_name="rundba",obzone="zone1",svr_ip="127.0.0.1",tenant_name="mysql_t1"} 6.290304e+06ob_cache_size_bytes{app="OB",cache_name="block_index_cache",ob_cluster_id="1",ob_cluster_name="rundba",obzone="zone1",svr_ip="127.0.0.1",tenant_name="sys"} 6.290304e+06...
4. 安装grafnana
1) 下载并安装
进入下载页面:
https://grafana.com/grafana/download
选择当前版本8.3.3,OSS(Open Source)版本,系统选择Linux。
Red Hat, CentOS, RHEL, and Fedora(64 Bit)SHA256: 57dd02bc2ea9a3e8e44cec963e4b3468b13a9e4792a571b65b5f01f99046c94d# wget https://dl.grafana.com/oss/release/grafana-8.3.3-1.x86_64.rpm# sudo yum install grafana-8.3.3-1.x86_64.rpm
可以视需求更改grafana数据、插件路径,此处默认。
2) 启动grafana服务
[root@monitor soft]# systemctl enable grafana-server[root@monitor soft]# systemctl start grafana-server[root@monitor soft]# systemctl status grafana-server[root@monitor soft]# ss -antlp | grep 3000LISTEN 0 128 [::]:3000 [::]:* users:(("grafana-server",pid=24985,fd=8))
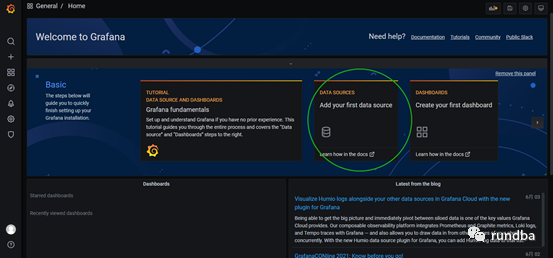
3) 登录grafana
打开浏览器
http://192.168.80.110:3000
输入用户名和口令admin/admin => 首次登陆更改密码,如Pde*#JH_l1
5. Grafana添加promethues数据源
1) 首页点击中间的“data sources”
2) 点击“Prometheus”-“Select”
3) 输入名称:Prometheus,URL:http://localhost:9090,即服务器地址及端口
4) 点击“保存和测试”
6. Grafana添加OceanBase监控模板
1) Grafana首页,点击左侧“+”--“Import”
Host Metrics:15216
输入OceanBase JSON文件编号15215,点击Load
或者输入https://Grafana.com/Grafana/dashboards/15215
xueran_test一栏选择“Premethues”,点击“Import”。
同样,导入主机指标,输入指标好15216。
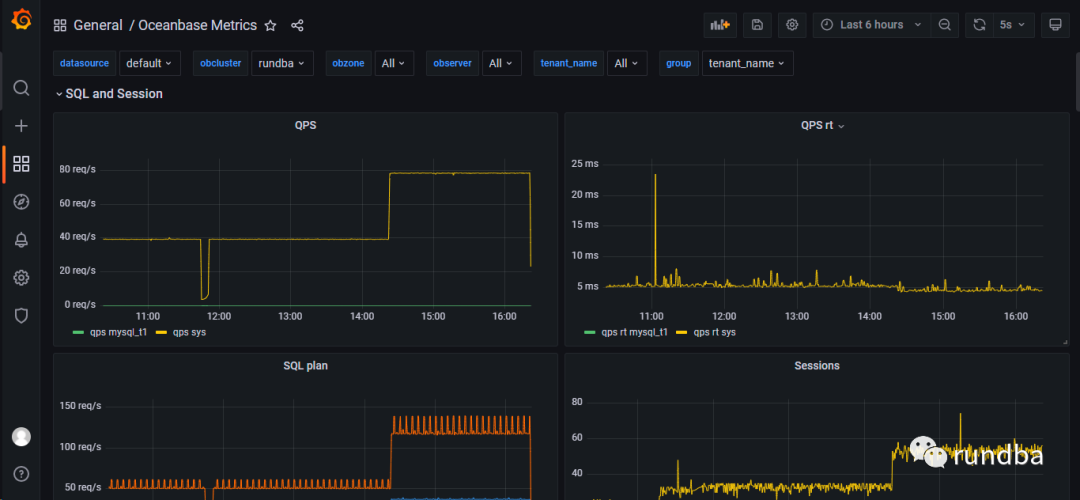
3) 查看监控项
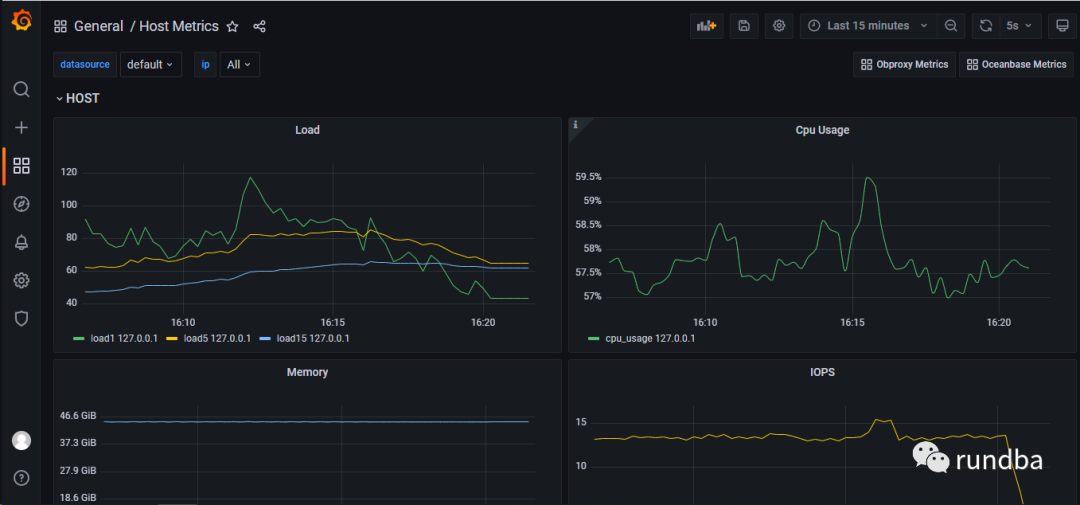
点击grafana左侧的”Search dashboards“ > Oceanbase Metrics,查看数据库指标:
4) 告警
7. 小结
使用OBD部署的OceanBase社区版,OCP 3.1.1_CE不支持接管,可使用OBAgent提供的prometheus监控模板,结合grafana进行OceanBase社区版的监控。
8. ref
https://github.com/oceanbase/obagent/blob/master/README-CN.mdhttps://github.com/oceanbase/obdeploy/tree/master/example/obagenthttps://open.oceanbase.com/docs/community/oceanbase-database/V3.1.2/use-obd-to-deploy-obagenthttps://open.oceanbase.com/docs/community/oceanbase-database/V3.1.2/use-obd-to-deploy-obagent#title-7bz-ivy-73r
旨在交流,不足之处,还望抛砖。
作者:王坤,微信公众号:rundba,欢迎转载,转载请注明出处。
如需公众号转发,请联系wx: landnow。