


This article describes how to use the zCloud platform to identify, trace and locate,and analyze and solve database issues in O&M.
To simply put, identify the problem within 1 min, locate problem within three and solve problem within 5.
for those who haven’t learned about zCloud, please click for primary introduction:
https://www.modb.pro/db/23395
The Opportunity and Challenge of Multi-Heterogeneous Architecture and Resources for PaaS Providers
now, pay attention…
With the continuous development of the financial sector, many financial institutions have built a certain fundamental platform for resource sharing and usage control, and the authority maintain to achieve the standardization and automation of O&M with many kinds of O&M tools such as monitoring, scoring portrait and performance analysis.
The use of these tools has improved the efficiency and quality of O&M in a way.
However, there are downsides as well, due to the large number of tools, many abnormal issues in the database need to be analyzed and located through several tools, which brings great management complexity and operational difficulty to DBA and management personnel, and increase the overall time-consuming, if the business interrupted for long time, it is inevitable to bring bad user experience and social impact especially for the financial providers.
The zCloud database cloud management platform can provide the full processing of the database traceability: problem identifying-problem locating-problem solving, helping the O&M personnel aware the database running status all the time, discovering the risk in time, and solving the problem in short time.
To simply put, identify the problem within 1 min, locate problem within three and solve problem within 5.
Problem Identification
The main Real-time visualization screen of zCloud display the running status of the database, such as the CPU usage, the memory trend, DB Time, table space used and free amount, and alert information that DBA should pay attention to.
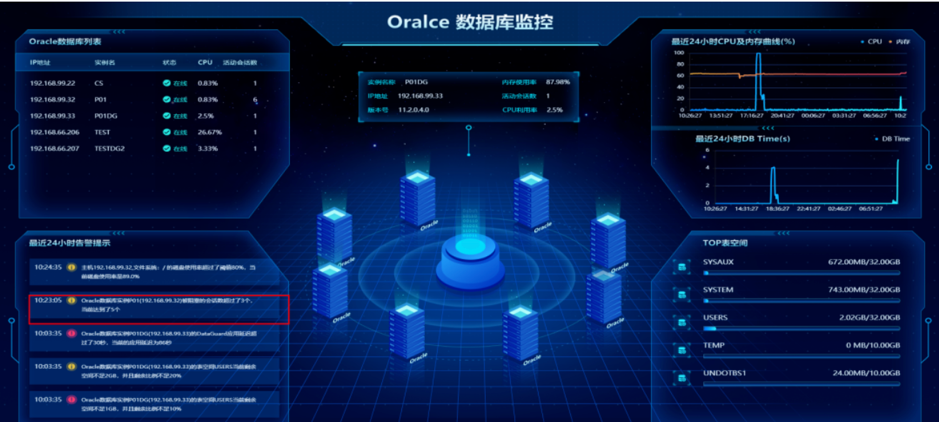
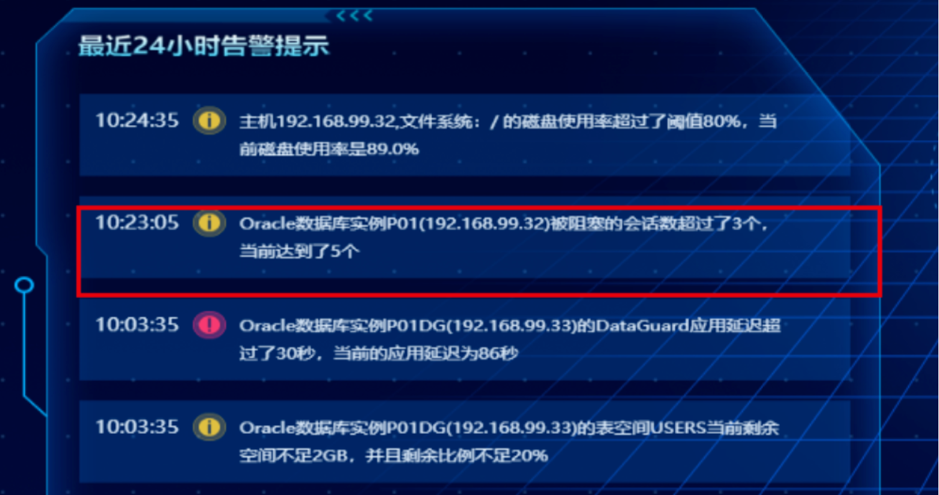
If we look into the alert display board on main visualization screen, we see that there is an alarm at 10:23:05: the number of sessions blocked by Oracle database instance P01 (192.168.99.32) exceeds 3, currently reaches 5. If the session blocked for too long, it will seriously affect the user’s experience and may cause more serious problems. Therefore, this kind of alert level is pretty high and needs to be checked and processed immediately.
Meanwhile, DBAs will receive the alert report from email, SMS, and etc(as long as the user configured the interface).
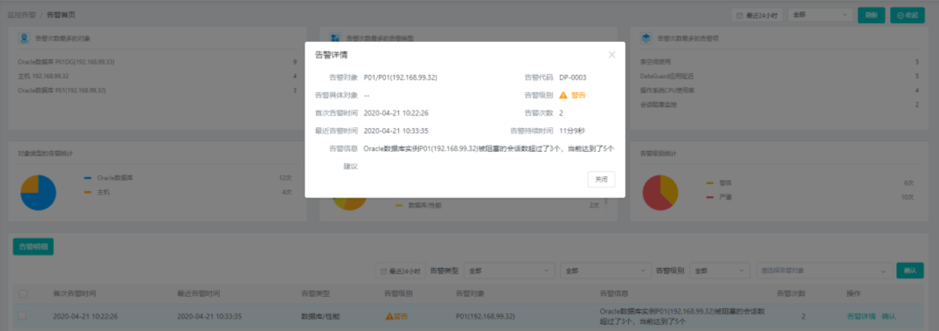
We can click the alert ID, then redirect to the alert homepage to get the details, such as the IP address of current issue, severity level, alarm duration, and detailed description.
As show in the picture, the first alarm time is 2020-4-21 10:22:26, and the latest alarm occurred at 10:33:35, which has been lasting 11 minutes!
Next, you can conduct in-depth analysis through the real-time performance analysis process provided by zCloud.
Problem Traceaility
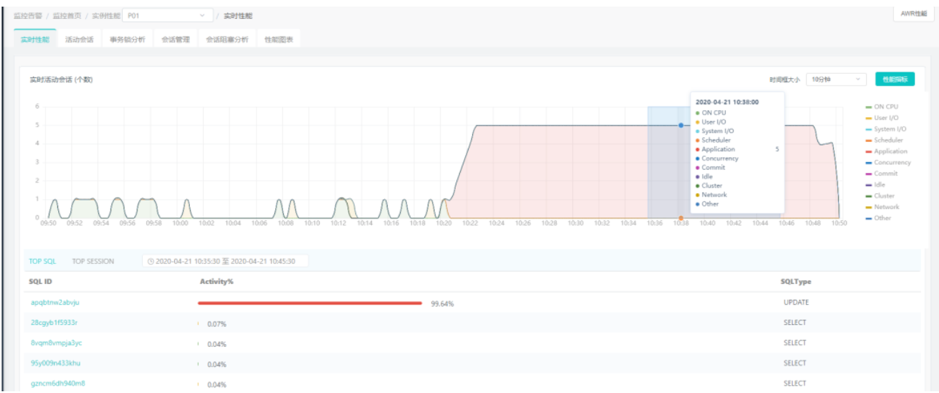
Entering the monitoring and alarm module of zCloud and find the P01 instance, we can see that the number of real-time active sessions has increased substantially from about 10:20 and has been high since, with the Application waiting counted the most proportion.
Then we narrow the scope of analysis data, frame the time interval from 10:20 to 10:40 in the trend graph, and we can identify the TOP SQL and TOP SESSION lists of the period.
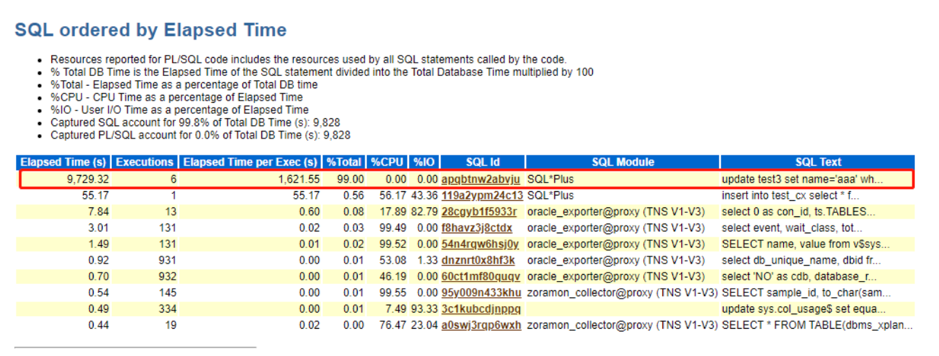
The UPDATE SQL with SQL ID apqbtnw2abvju takes up 99.64% of the Activity%,
there must be something wrong…
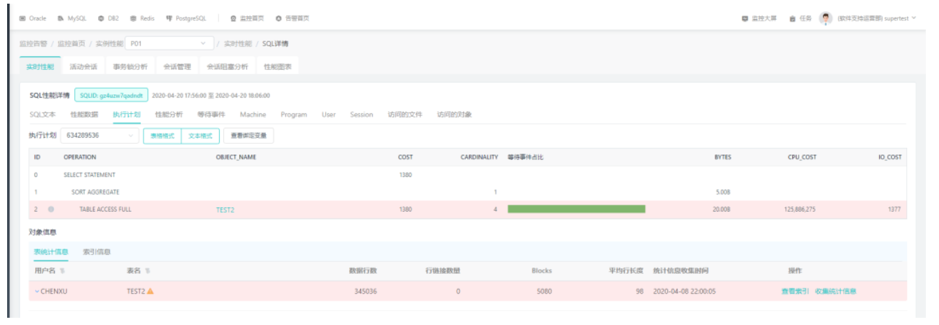
Click the SQL ID to view the details of this SQL, and based on which to analyze the SQL text and execution plan, and the SQL access objects.
The red marked part is where the SQL problem is. You can see that the operation of the execution plan is TABLE ACCESS FULL full table scan, the object name is TEST2, with the CPU consuming is 125,886,275, and the IO consuming is 1377, and no need to say a lot of waiting event.
SQL performance details provide statistics of object information, so we can view the statistical information of TEST2 table, such as user name, number of data rows, block size, indexes and etc.
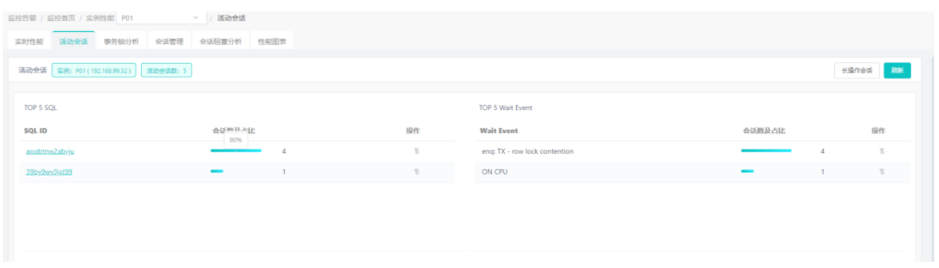
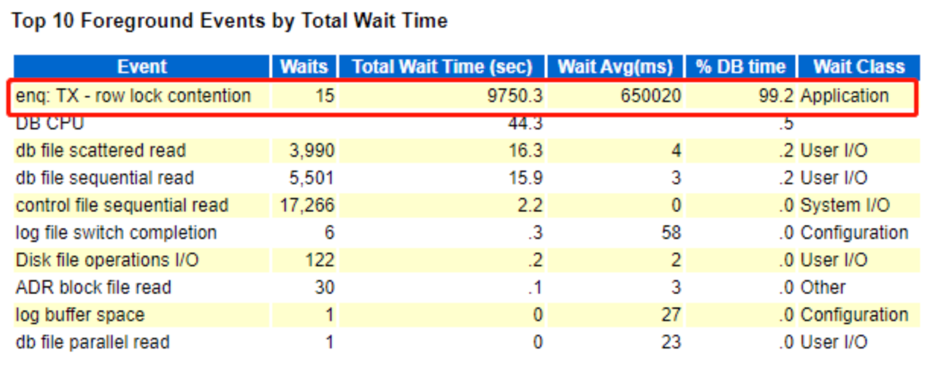
To be able to analyze the alarm situation in multiple dimensions, we can view the status of the active session. No surprise, the TOP SQL is still trying to execute in active session. There are 4 sessions in all, taking up the 80% of system resources. the TOP wait event in these four sessions is enq: TX -row lock contention
So, it turned out to be resulted from the session was blocked, a row-level lock waiting event!
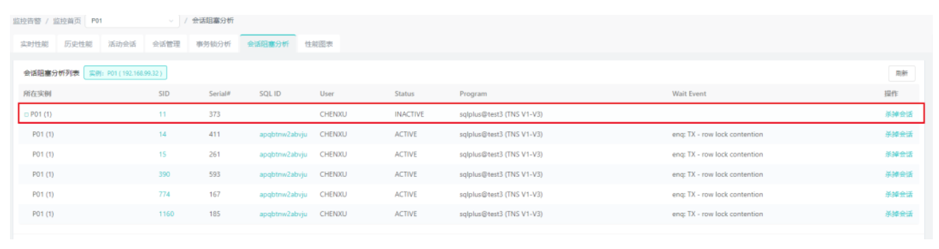
Next, through the tab page of the session blocking analysis, you can see that the first line is the blocking source.
There, the alarm problem has been quickly located to the source.
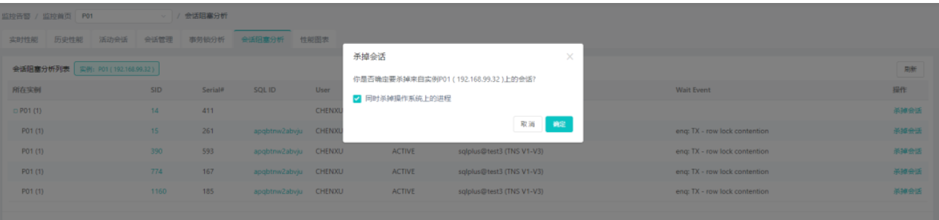
Problem Processing
zCloud provides the function of killing a session with one click. The DBA can directly click “kill session” button after locate the high consuming session to quickly solve the problem. Since the operation to kill a session is of high-risk, it is recommended to double confirm before execute it.
Problem Review
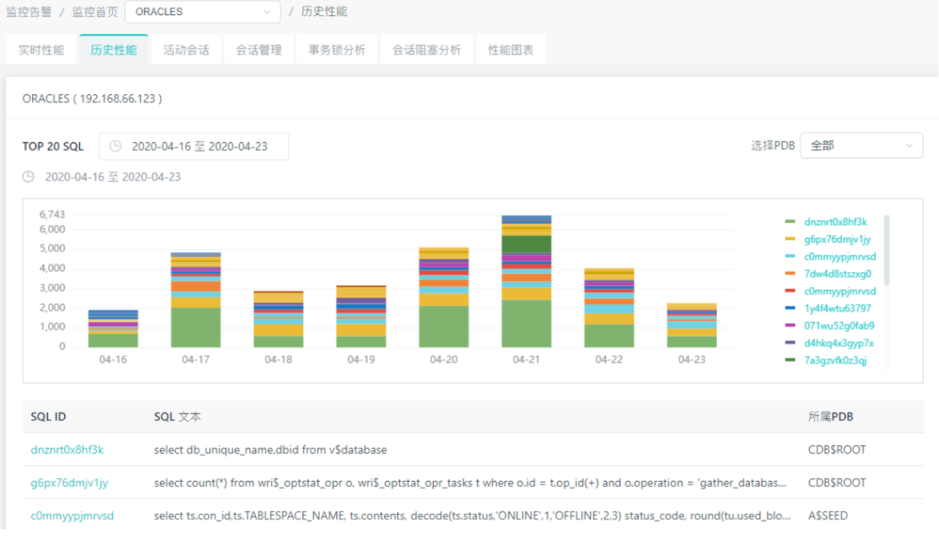
The zCloud platform provides historical performance viewing at any time in the past two years. You can select a range to view historical TOP SQL and deep trace to analyze the details.
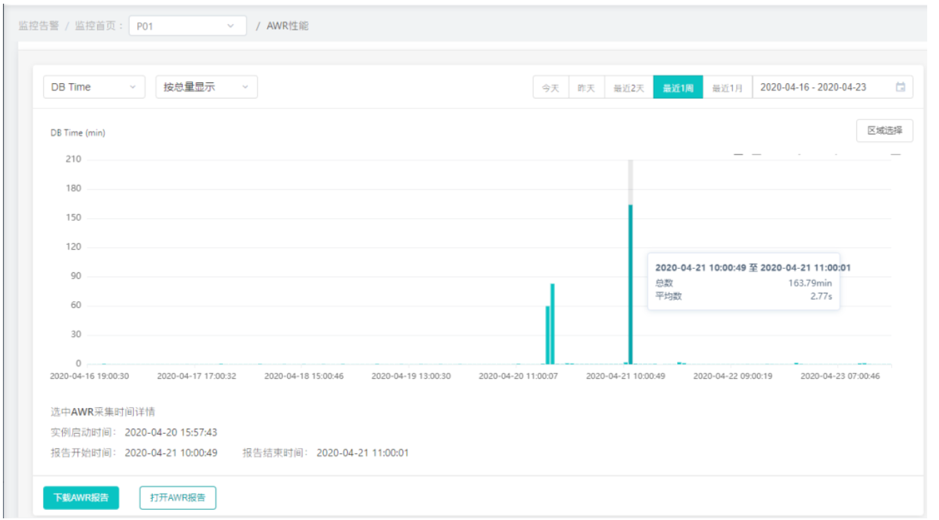
For user’s convenience, zCloud also generate AWR report and view online at any time to easily record events. For example, select the period from 10:00 to 11:00 in 2020-04-21, and generate AWR reports for event analysis and recording.
zCloud is a database cloud management platform that helps large enterprises achieve centralized management and efficient use of database resources, simplify database operation and maintenance with automated and intelligent functions in a private cloud environment, and helps customers optimize resources to reduce costs, and quickly deliver databases to provide efficient IT support for rapid business growth.
