


一、 获取跟踪文件-oradebug
1 获取当前会话
SQL> oradebug setmypid
Statement processed.
SQL> oradebug tracefile_name
/u01/oracle/app/diag/rdbms/orcl/orcl/trace/orcl_ora_11588.trc
SQL> oradebug close_trace;
//oradebug只能sys/system用,普通用户无法用
2 获取其他会话
oradebug setospid 24008
Oracle pid: 23, Unix process pid: 24008, image: oracle@itpuxasm (TNS V1-V3)
oradebug tracefile_name
/oracle/app/oracle/diag/rdbms/itpuxfs/itpuxfs/trace/itpuxfs_ora_24008.trc
//oradebug只能sys/system用,普通用户无法用
3 参数文件查看
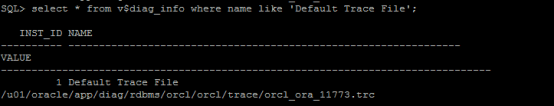
select * from v$diag_info where name like 'Default Trace File';
4 根据 SID 查 TRACE 文件
select '*' || spid || '.trc' from v$process where addr = (select
paddr from v$session where sid = 131);
5.通过 SQL 查询
SELECT d.value || '/' || lower(rtrim(i.instance_name, chr(0))) ||
'_ora_' ||
p.spid || '.trc' trace_file_name
FROM (SELECT p.spid
FROM v$mystat m, v$session s, v$process p
WHERE m.statistic# = 1
AND s.sid = m.sid
AND p.addr = s.paddr) p,
(SELECT instance_name FROM v$instance) i,
(SELECT VALUE FROM v$parameter WHERE NAME =
'user_dump_dest') d;
二、 sql 语句跟踪:sql_trace
1 本地会话跟踪
alter session set sql_trace=true;
--说明:会话级的
--trace 文件做标记
alter session set tracefile_identifier='itpuxtrc';
alter session set sql_trace=false;
2 打开其它用户的跟踪
select sid from v$mystat where rownum <2;
select sid,serial# from v$session where sid=192;
sql> exec dbms_system.set_sql_trace_in_session(192,199,true);
pl/sql procedure successfully completed.
等一会儿(语句执行完)
sql> exec dbms_system.set_sql_trace_in_session(192,199,false)
--------------------------------------
//查看trc文件名
select '*' || spid || '.trc' from v$process where addr = (select
paddr from v$session where sid = 192);
3、根据pid 根据会话或者获取sql语句
1>根据top 看到的pid查看sid和serial#
select sid,serial# ,username,osuser,machine,program,process,to_char(logon_time,'yy
yy/mm/dd hh24:mi:ss') logon from v$session where paddr in ( select addr
from v$process where spid in('&pid'));
这里得到150,297
2>根据sid和serial#,用dbms_system.set_sql_trace根据:
select sid from v$mystat where rownum <2;
select sid,serial# from v$session where sid=192;
sql> exec dbms_system.set_sql_trace_in_session(192,199,true);
pl/sql procedure successfully completed.
等一会儿(语句执行完)
sql> exec dbms_system.set_sql_trace_in_session(192,199,false)
--------------------------------------
//查看trc文件名
select '*' || spid || '.trc' from v$process where addr = (select
paddr from v$session where sid = 192);
3>根据pid查看sql语句
select sql_text from v$sqltext_with_newlines where hash_value in (select
SQL_HASH_VALUE from v$session where paddr in (select addr from v$process
where spid= '&pid')) order by piece;
三、 tkprof 工具分析 trace 的使用方法
1 tkprof 工具常用参数介绍
tkprof xxxxxx.trc xxxxx.out sys=on[optional|parameters];
[oracle@itpuxasm ~]$ tkprof
Usage: tkprof tracefile outputfile [explain= ] [table= ]
[print= ] [insert= ] [sys= ] [sort= ]
table=schema.tablename Use 'schema.tablename' with 'explain=' option.
explain=user/password Connect to ORACLE and issue EXPLAIN PLAN.
print=integer List only the first 'integer' SQL statements.
aggregate=yes|no
insert=filename List SQL statements and data inside INSERT statements.
sys=no TKPROF does not list SQL statements run as user SYS.
record=filename Record non-recursive statements found in the trace file.
waits=yes|no Record summary for any wait events found in the trace
file.
sort=option Set of zero or more of the following sort options:
prscnt number of times parse was called
prscpu cpu time parsing
prsela elapsed time parsing
prsdsk number of disk reads during parse
prsqry number of buffers for consistent read during parse
prscu number of buffers for current read during parse
prsmis number of misses in library cache during parse
execnt number of execute was called
execpu cpu time spent executing
exeela elapsed time executing
exedsk number of disk reads during execute
exeqry number of buffers for consistent read during execute
execu number of buffers for current read during execute
exerow number of rows processed during execute
exemis number of library cache misses during execute
fchcnt number of times fetch was called
fchcpu cpu time spent fetching
fchela elapsed time fetching
fchdsk number of disk reads during fetch
fchqry number of buffers for consistent read during fetch
fchcu number of buffers for current read during fetch
fchrow number of rows fetched
userid userid of user that parsed the cursor
tracefile 指定的输入文件,可以是多个文件联起来。
outputfile 格式化输出文件。
table:table 参数只和 explain 参数一起使用,用来指定某个表被 explain plan 语句
使用来生成执行计划,通常尽量避免使用 table 参数。
explain:explain 对每条 sql 语句确定其执行计划。并将执行计划写到输出文件中。
参 数 格 式 为 explain=username/password@server_name 或 者
explain=username/password,这个参数是通过执行 explain plan 语句来做到的,
在 trace 文件中找到每个 sql 语句,提供一个执行计划。一般不是必要情况,指定这
个参数并不可取,一旦指定了无效的信息,在输出的文件就会出现 error。
print:参数用来限制输出文件生成的 sql 语句的数量,默认是无限制的。eg:只输出
10 个 sql 语句,则参数指定 print=10,一般和 sort 参数一起使用才具有一定的意义。
insert : 生 成 sql 脚 本 , 脚 本 可 以 用 来 把 数 据 存 储 到 数 据 库 中 。 eg :
insert=load_data.sql 。
sys:参数执行 sys 用户下运行的 sql 语句是否写入到输出文件,默认为 yes。可设置
为 no,避免输出不必要的信息,这个看情况而定吧。这个参数设置为 no 可以阻止所
有以 sys 用户执行的 sql 被显示出来,这样可以减少分析出来的文件的复杂度,便于
查看。
aggregate:参数指定是否合并相同的 sql,默认为 yes,设置为 no,输出文件就会
列出每个 sql 的消耗情况等信息。
record=recordfile 这个选项创建一个名为 recorderfile 的文件,包含了所有重调用
的 sql 语句
用得比较多的一般是 sys 和 aggregate 参数。
waits=yes|no:是否统计任何等待事件
sort:排序的意思,指定输出文件里面的 sql 语句的顺序,默认是 trace 源文件里面的
sql 顺序。你可以指定根据 cpu 时间,物理读的块数,调用次数等进行排序,eg:
sort=elapsed,disk — 多 个 排 序 用 逗 号 隔 开 。 一 般 使 用 fchela elapsed time
fetching。其中比较有用的一个排序选项是 fchela,即按照 elapsed time fetching
来对分析的结果排序(记住要
设置初始化参数 timed_statistics=true),生成的文件将把最消耗时间的 sql 放在最
前面显示。
sort=sort_option 按照指定的方法对 sql trace 的输出文件进行降序排序
sort_option 选项
prscnt 按解析次数排序
prscpu 按解析所花 cpu 时间排序
prsela 按解析所经历的时间排序
prsdsk 按解析时物理的读操作的次数排序
prsqry 按解析时以一致模式读取数据块的次数排序
prscu 按解析时以当前读取数据块的次数进行排序
execnt 按执行次数排序
execpu 按执行时花的 cpu 时间排序
exeela 按执行所经历的时间排序
exedsk 按执行时物理读操作的次数排序
exeqry 按执行时以一致模式读取数据块的次数排序
execu 按执行时以当前模式读取数据块的次数排序
exerow 按执行时处理的记录的次数进行排序
exemis 按执行时库缓冲区的错误排序
fchcnt 按返回数据的次数进行排序
fchcpu 按返回数据 cpu 所花时间排序
fchela 按返回数据所经历的时间排序(取操作)
fchdsk 按返回数据时的物理读操作的次数排序
fchqry 按返回数据时一致模式读取数据块的次数排序
fchcu 按返回数据时当前模式读取数据块的次数排序
fchrow 按返回数据时处理的数据数量排序
2 tkprof 使用介绍
tkprof db01_ora_21842.trc db01_ora_21842.trc.txt aggregate=yes sys=no
这样,格式化的后就输出到/oracle/xxx.txt 中。
备注:
sys=no:表示阻止所有以sys用户执行的sql被显示出来,默认为YES
aggregate=yes|no 若用户指定AGGREGATE=NO,TKPROF将不会对相同SQL文本的多个用户进行汇总
 硬解析次数
硬解析次数
OVERALL TOTALS FOR ALL NON-RECURSIVE STATEMENTS:所有非递归语句的总数
OVERALL TOTALS FOR ALL NON-RECURSIVE STATEMENTS:所有递归语句的总数
四、10046 事件与使用详解
1、10046 跟踪级别介绍
0,1,4,8,·12,16,32,64
2、与 10046 相关的参数
在打开 10046 事件的 SQL Trace 之前,要先设置好下面几个参数。
timed_statistics
max_dump_file_size
tracefile_identifier
statistics_level
要在当前会话修改上述参数很简单,只要使用下面的命令即可:
ALTER SESSION SET timed_statistics=true
ALTER SESSION SET max_dump_file_size=unlimited
ALTER SESSION SET tracefile_identifier='itpux'
alter session set statistics_level=all;
select * from v$diag_info where name like 'Default Trace File';
3、10046 常用方法
grant alter session to user;---授权
--第一种:
--打开 10046 跟踪
1>第一种—alter session
--会话级别
alter sesssion set events '10046 trace name context forever,level 12';
--0,1,4,8,12,16,32,64
02.pfile/spfile 加入(全局)
event = 10046 trace name context forever,level 12;
--关闭 10046 跟踪
alter session set events '10046 trace name context off';
2>第二种-oradebug
sys@itpuxfs> oradebug setmypid
Statement processed.
sys@itpuxfs> oradebug event 10046 trace name context forever,level 12;
Statement processed.
sys@itpuxfs> select count(*) from itpux.itpux_member;
COUNT(*)
----------
10000000
sys@itpuxfs> oradebug event 10046 trace name context off;
Statement processed.
sys@itpuxfs> oradebug tracefile_name
/oracle/app/oracle/diag/rdbms/itpuxfs/itpuxfs/trace/itpuxfs_ora_29948.trc
3>第三种-dbms_system
dbms_system
exec dbms_system.set_ev(123,123456,10046,12,'itpux');
PL/SQL procedure successfully completed.
exec dbms_system.set_sql_trace_in_session(123,123456,true);
exec dbms_system.set_sql_trace_in_session(123,123456,false);
exec dbms_system.set_ev(123,123456,10046,0,'itpux');
PL/SQL procedure successfully completed.
--set_ev 参数:
--sid,serial#,事件,级别,用户名
4> bind变量案例

5>10046 案例
1,本地会话
conn itpux/itpux
alter session set events '10046 trace name context forever,level 12';
select id,name,cardid from itpux_member wherename='itpux12345';
alter session set events '10046 trace name context off';
select * from v$diag_info where name like 'Default Trace File';
2:其它会话:
conn itpux/itpux
select sid from v$mystat where rownum=1;
SID
----------
141
select sid,serial# from v$session where sid=141;
SID SERIAL#
---------- ----------
141 425
select sid,serial#,username from v$session where username is
not null;
SID SERIAL# USERNAME
---------- ---------- ------------------------------
19 335 SYS
138 887 SYS
141 425 ITPUX
146 519 SYS
exec dbms_system.set_ev(141,425,10046,12,'ITPUX');
PL/SQL procedure successfully completed.
exec dbms_system.set_sql_trace_in_session(141,425,true);
PL/SQL procedure successfully completed.
exec dbms_system.set_sql_trace_in_session(141,425,false);
exec dbms_system.set_ev(141,425,10046,0,'ITPUX');
PL/SQL procedure successfully completed.
3:跟踪一个已经在运行的会话:
//查看当前连接数据库的sid、serial#,对应的pid,客户端信息等等:
select 'ospid: ' || p.spid || ' # ''' ||s.sid||','||s.serial#||''' '||
s.osuser || ' ' ||s.machine ||' '||s.username ||' '||s.program line
from v$session s , v$process p
where p.addr = s.paddr
and s.username <> ' ';
connect / as sysdba
oradebug setospid 9834
或者
oradebug setorapid 9834 --ora pid
oradebug unlimit
oradebug event 10046 trace name context forever,level 12
oradebug event 10046 trace name context off;
4:在整个实例级别设置。
alter system set events '10046 trace name context forever,level 12';
alter system set events '10046 trace name context off';
select * from v$diag_info where name like 'Default Trace File';
5:在初始化参数中设置(作业)
pfile/spfile 加入(全局)
event = 10046 trace name context forever,level 12;
6:通过触发器在登录时设置。
create or replace trigger sys.set_trace
after logon on database
when (USER like 'ITPUX')
begin
execute immediate 'alter session set
tracefile_identifier=''itpux_trigger''';
execute immediate 'alter session set events ''10046 trace name context
forever,level 12''';
end set_trace;
/
of
create or replace trigger user_logon_tiger
after logon on database
begin
if USER='ITPUX' then
execute immediate 'alter session set
tracefile_identifier=''itpux_trigger''';
execute immediate 'alter session set events ''10046 trace name context
forever,level 12''';
end if;
end;
/
四、 dbms_monitor
1、基于会话 ID 与序列号设置跟踪
//开始
begin
dbms_monitor.session_trace_enable(session_id => 18,
serial_num => 226,
waits => true, --等待事
件,默认为 true
binds => true, --绑定变
量,默认为 false
[plan_stat => ]); --11g 新添加的参数,
设置采集频率,较少使用
end;
/
//关闭
dbms_monitor.session_trace_disable(session_id => x, serial_num => y);
案例:
select * from v$mystat where rownum=1;
select sid,serial# from v$session where sid=141;
-- SID SERIAL#
-------------- ----------
-- 141 447
select * from dba_enabled_traces;
begin
dbms_monitor.session_trace_enable(141,447);
end;
/
/** 执行sql **/
begin
dbms_monitor.session_trace_disable(141,447);
end;
/
2、基于客户端标识符设置跟踪
itpux@itpuxfs> select * from v$mystat where rownum=1;
SID STATISTIC# VALUE
---------- ---------- ----------
141 0 0
itpux@itpuxfs> select sid,serial# from v$session where sid=141;
SID SERIAL#
---------- ----------
141 451
itpux@itpuxfs> execute dbms_session.set_identifier('itpux');
PL/SQL procedure successfully completed.
itpux@itpuxfs> select sys_context('USERENV','CLIENT_IDENTIFIER') client_id
from dual;
CLIENT_ID
--------------------------------------------------------------------------------
itpux
-----------
sys@itpuxfs> select client_identifier from v$session where sid=141;
CLIENT_IDENTIFIER
----------------------------------------------------------------
itpux
sys@itpuxfs> execute dbms_monitor.client_id_trace_enable('itpux');
PL/SQL procedure successfully completed.
-------------
itpux@itpuxfs> select id,name,recommend from itpux_member where
name='itpux722222';
ID NAME RECOMMEND
---------- -------------------- ----------
722222 itpux722222 风哥 2 号
-----------------
sys@itpuxfs> execute dbms_monitor.client_id_trace_disable('itpux');
PL/SQL procedure successfully completed.
-----------------
itpux@itpuxfs> select * from v$diag_info where name like 'Default Trace File';
INST_ID NAME
---------- ----------------------------------------------------------------
VALUE
--------------------------------------------------------------------------------
1 Default Trace File
/oracle/app/oracle/diag/rdbms/itpuxfs/itpuxfs/trace/itpuxfs_ora_4994.trc
3、服务名/模块名/操作名的跟踪
//查询:
select SERVICE_NAME, MODULE,ACTION from V$SESSION;
//Enable Tracing
execute dbms_monitor.serv_mod_act_trace_enable('Service1', 'Module1',
'Action1', waits => (TRUE|FALSE), binds => (TRUE|FALSE), instance_name =>
'ORCL' );
//Disable Tracing
execute dbms_monitor.serv_mod_act_trace_disable('Service1', 'Module1',
'Action1');
The default for waits is TRUE and the default for binds is FALSE.
The default for instance_name is null.
//案例:
select service_name,module,action from v$session;
begin
dbms_monitor.serv_mod_act_trace_enable(' SYS$USERS',' SQL*Plus');
end;
/
//** 打开sqlplus操作 **/
begin
dbms_monitor.serv_mod_act_trace_disable('SYS$USERS','SQL*Plus');
end;
/
