


建一个监控表,编写角本每30分钟采集一次表空每个库的表空间使用情况
表结构示例(我们的示例表名为db_freespace)
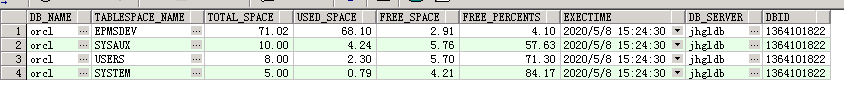
分析表空间使用(SQL)
with t as
 (select *
    from db_freespace t
   where db_name = 'orcl' /*修改dbname*/
     and exectime between sysdate - (30 / 1440) and sysdate),
t2 as
 (select db_name,
         tablespace_name,
         max(used) - min(used) req_space,
         LISTAGG(used_space, ',') WITHIN GROUP(order by exectime) used_hist
    from (select db_name,
                 tablespace_name,
                 exectime,
                 used_space used,
                 (used_space - lag(used_space)
                  over(partition by db_name, tablespace_name order by exectime)) * 1000 used_space
            from db_freespace
           where db_name = 'orcl' /*修改dbname*/
             and exectime >= trunc(add_months(sysdate, -2), 'mm') --between sysdate-61 and  sysdate
             and to_char(exectime, 'mi') >= '30'
             and to_char(exectime, 'hh24') in ('00'))
   where used_space is not null
   group by db_name, tablespace_name)
select t.db_name,
       t.tablespace_name,
       total_space,
       used_space,
       free_space,
       free_percents,
       req_space,
       to_char(exectime, 'yyyy-mm-dd hh24:mi:ss') exectime,
       t.tablespace_name,
       t2.used_hist
  from t
  left join t2
    on t.db_name = t2.db_name
   and t.tablespace_name = t2.tablespace_name
 order by t.db_name, t.tablespace_name
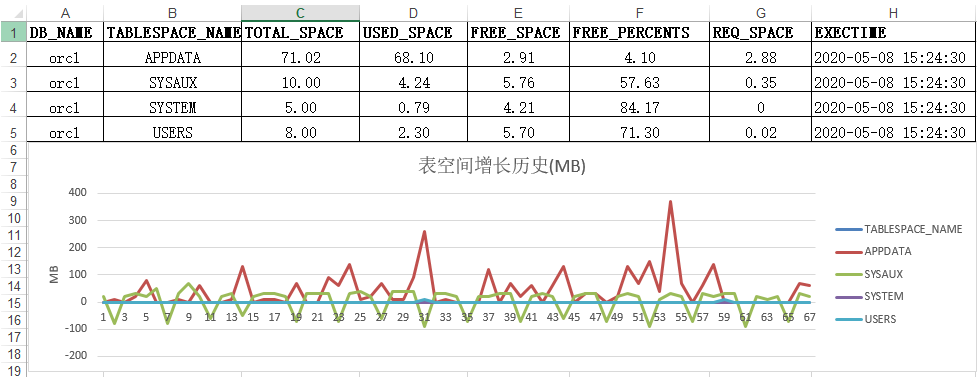
查询结果导出到EXCEL
使用EXCEL 数据\分列,对used_hist列进行分列(逗号分割),结果如下

##生成折线图
选择列(从TABLESPACE_NAME至最好一列),插入折线图,每天的增长、下降(清理数据),可以根据自己需要调整粒度。
- 大于0为增长
- 小于0为清理

最后修改时间:2020-05-10 19:05:46
「喜欢这篇文章,您的关注和赞赏是给作者最好的鼓励」
关注作者
【版权声明】本文为墨天轮用户原创内容,转载时必须标注文章的来源(墨天轮),文章链接,文章作者等基本信息,否则作者和墨天轮有权追究责任。如果您发现墨天轮中有涉嫌抄袭或者侵权的内容,欢迎发送邮件至:contact@modb.pro进行举报,并提供相关证据,一经查实,墨天轮将立刻删除相关内容。
