问题
SQL Server在很多企业中部署在多个平台上(Windows,Linux和Container),需要一种能支持多平台的解决方案用于收集和展示相关的监控指标。
我选择企业中比较流行的监控展示工具Grafana和监控指标收集工具Telegraf进行实现。这也是为了方便与企业中已经在存在监控平台进行整合和对接。
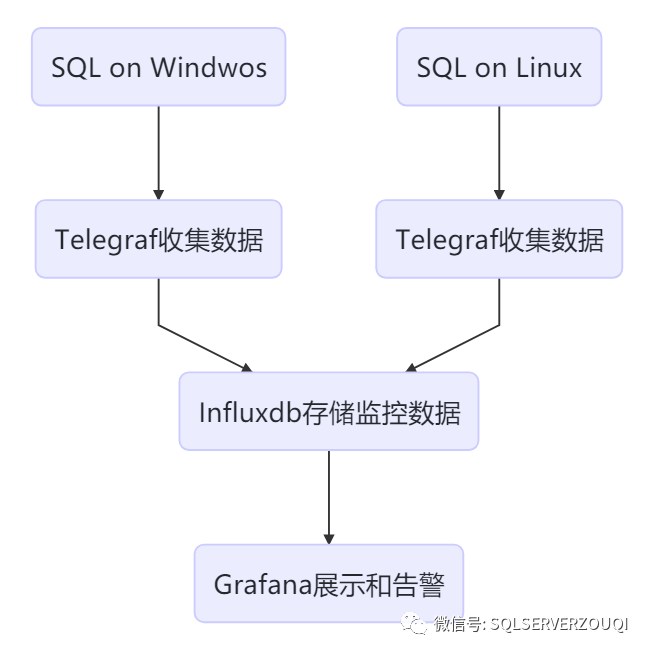
如上图所示,Telegraf部署在SQL所在host,收集数据发送给时序数据库Influxdb存储,然后Grafana用于展示数据。
解决方案
安装和配置InfluxDB
# 下载1.8的stable version后进行安装wget https://dl.influxdata.com/influxdb/releases/influxdb-1.8.0.x86_64.rpmchmod 755 influxdb-1.8.0.x86_64.rpmyum localinstall influxdb-1.8.0.x86_64.rpm# 启动并设置自启动systemctl start influxdbsystemctl enable influxdb# 8086用于客户端的HTTP连接,8088用于CLI调用RPC进行备份和还原操作firewall-cmd --zone=public --add-port=8086/tcp --permanentfirewall-cmd --zone=public --add-port=8088/tcp --permanentfirewall-cmd --reload# 连接到influxdb并创建用户fluxdb> CREATE USER admin WITH PASSWORD '<password>' WITH ALL PRIVILEGES# 启用http用户验证,修改influxdb.conf中http section中auth-enabled = truevim etc/influxdb/influxdb.confsystemctl restart influxdb# 创建用于存储监控数据的数据库,保存6个月的数据influx -username 'admin' -password '<password>'> CREATE DATABASE telegraf> CREATE RETENTION POLICY telegraf_6m ON telegraf DURATION 180d REPLICATION 1 DEFAULT> SHOW DATABASES
安装和配置Grafana
# 下载并安装Grafanawget https://dl.grafana.com/oss/release/grafana-7.0.1-1.x86_64.rpmchmod 775 grafana-7.0.1-1.x86_64.rpmyum localinstall grafana-7.0.1-1.x86_64.rpm# 设置自启动systemctl start grafana-server.servicesystemctl enable grafana-server.service# 允许Grafana默认的端口3000firewall-cmd --zone=public --add-port=3000/tcp --permanentfirewall-cmd --reload
然后在Browser中访问http://:3000,第一次访问时默登录认账号和密码都为admin,登录后会提示修改密码。
在在被监控的数据库主机安装和配置Telegraf
Telegraf连接到SQL,需要一个login,具有 VIEW SERVER STATE and VIEW ANY DEFINITION的权限,所以在每个被监控的实例上都需要创建之。
USE master;GOCREATE LOGIN [telegraf] WITH PASSWORD = N'1qaz@WSX';GOGRANT VIEW SERVER STATE TO [telegraf];GOGRANT VIEW ANY DEFINITION TO [telegraf];GO
Telegraf on Linux
wget https://dl.influxdata.com/telegraf/releases/telegraf-1.14.3-1.x86_64.rpmsudo yum localinstall telegraf-1.14.3-1.x86_64.rpm
安装完成后,先要修改Telegraf的配置文件,再启动。在配置文件中主要配置两个部分:inputs和outputs。inputs表示监控数据从哪里来,outputs表示监控要发送到哪里去。
打开/etc/telegraf/telegraf.conf,找到[[outputs.influxdb]]部分,所有配置项默认都被注释了。我们需要删除注释并配置一些项。主要是Influxdb的地址,用户名、密码和数据库名等。
[[outputs.influxdb]]## The full HTTP or UDP URL for your InfluxDB instance.#### Multiple URLs can be specified for a single cluster, only ONE of the## urls will be written to each interval.# urls = ["unix:///var/run/influxdb.sock"]# urls = ["udp://127.0.0.1:8089"]urls = ["http://172.17.2.4:8086"]## The target database for metrics; will be created as needed.## For UDP url endpoint database needs to be configured on server side.database = "telegraf"## The value of this tag will be used to determine the database. If this## tag is not set the 'database' option is used as the default.# database_tag = ""## If true, the 'database_tag' will not be included in the written metric.# exclude_database_tag = false## If true, no CREATE DATABASE queries will be sent. Set to true when using## Telegraf with a user without permissions to create databases or when the## database already exists.skip_database_creation = true## Name of existing retention policy to write to. Empty string writes to## the default retention policy. Only takes effect when using HTTP.retention_policy = ""## The value of this tag will be used to determine the retention policy. If this## tag is not set the 'retention_policy' option is used as the default.# retention_policy_tag = ""## If true, the 'retention_policy_tag' will not be included in the written metric.# exclude_retention_policy_tag = false## Write consistency (clusters only), can be: "any", "one", "quorum", "all".## Only takes effect when using HTTP.write_consistency = "any"## Timeout for HTTP messages.timeout = "5s"## HTTP Basic Authusername = "admin"password = "<password>"
找到[[inputs.sqlserver]]部分,取消相关配置项的注释,servers部分连接到本地实例。
Telegraf默认的Plugin中包括了对SQL Server的实现, 这个Plugin还包括了对Azure SQL PaaS的实现
# # Read metrics from Microsoft SQL Server[[inputs.sqlserver]]# ## Specify instances to monitor with a list of connection strings.# ## All connection parameters are optional.# ## By default, the host is localhost, listening on default port, TCP 1433.# ## for Windows, the user is the currently running AD user (SSO).# ## See https://github.com/denisenkom/go-mssqldb for detailed connection# ## parameters, in particular, tls connections can be created like so:# ## "encrypt=true;certificate=<cert>;hostNameInCertificate=<SqlServer host fqdn>"servers = ["Server=localhost;Port=1433;User Id=telegraf;Password=<yourPassword>;app name=telegraf;log=1;"]## ## Optional parameter, setting this to 2 will use a new version# ## of the collection queries that break compatibility with the original# ## dashboards.query_version = 2## ## If you are using AzureDB, setting this to true will gather resource utilization metrics# # azuredb = false## ## Possible queries:# ## - PerformanceCounters# ## - WaitStatsCategorized# ## - DatabaseIO# ## - DatabaseProperties# ## - CPUHistory# ## - DatabaseSize# ## - DatabaseStats# ## - MemoryClerk# ## - VolumeSpace# ## - PerformanceMetrics# ## - Schedulers# ## - AzureDBResourceStats# ## - AzureDBResourceGovernance# ## - SqlRequests# ## - ServerProperties# ## A list of queries to include. If not specified, all the above listed queries are used.# # include_query = []## ## A list of queries to explicitly ignore.# exclude_query = [ 'Schedulers' , 'SqlRequests']
启动Telegraf之后,可以看到时已经加载的inputs和收集间隔
[root@SQL19N1 log]# systemctl status telegraf● telegraf.service - The plugin-driven server agent for reporting metrics into InfluxDBLoaded: loaded (/usr/lib/systemd/system/telegraf.service; enabled; vendor preset: disabled)Active: active (running) since Tue 2020-05-26 14:19:07 UTC; 19min agoDocs: https://github.com/influxdata/telegrafMain PID: 12359 (telegraf)CGroup: /system.slice/telegraf.service└─12359 /usr/bin/telegraf -config etc/telegraf/telegraf.conf -config-directory etc/telegraf/telegraf.dMay 26 14:19:07 SQL19N1 systemd[1]: Started The plugin-driven server agent for reporting metrics into InfluxDB.May 26 14:19:07 SQL19N1 telegraf[12359]: 2020-05-26T14:19:07Z I! Starting Telegraf 1.14.3May 26 14:19:07 SQL19N1 telegraf[12359]: 2020-05-26T14:19:07Z I! Loaded inputs: system cpu disk diskio kernel mem processes swap sqlserverMay 26 14:19:07 SQL19N1 telegraf[12359]: 2020-05-26T14:19:07Z I! Loaded aggregators:May 26 14:19:07 SQL19N1 telegraf[12359]: 2020-05-26T14:19:07Z I! Loaded processors:May 26 14:19:07 SQL19N1 telegraf[12359]: 2020-05-26T14:19:07Z I! Loaded outputs: influxdbMay 26 14:19:07 SQL19N1 telegraf[12359]: 2020-05-26T14:19:07Z I! Tags enabled: host=SQL19N1May 26 14:19:07 SQL19N1 telegraf[12359]: 2020-05-26T14:19:07Z I! [agent] Config: Interval:20s, Quiet:false, Hostname:"SQL19N1", Flush Interval:10s
Telegraf on Windows
以管理员身份执行如下PowerShell命令
# 下载软件wget https://dl.influxdata.com/telegraf/releases/telegraf-1.14.3_windows_amd64.zip ·-OutFile "c:\temp\telegraf-1.14.3_windows_amd64.zip"# 解压缩到C:\Program Files\TelegrafExpand-Archive "c:\temp\telegraf-1.14.3_windows_amd64.zip", "C:\Program Files"# 将telegraf安装为windows服务C:\"Program Files"\Telegraf\telegraf.exe --service install
修改telegraf.conf中outputs.influxdb和添加inputs.sqlserver部分,这些内容和在Linux上的配置一样,就不赘述了。
conf修改完成后,可以先测试一下telegraf是否能正常启动,没问题的话就启动telegraf服务。
# 测试C:\"Program Files"\Telegraf\telegraf.exe --config C:\"Program Files"\Telegraf\telegraf.conf --test# 启动服务C:\"Program Files"\Telegraf\telegraf.exe --service start
配置Grafana的数据源和Dashboard
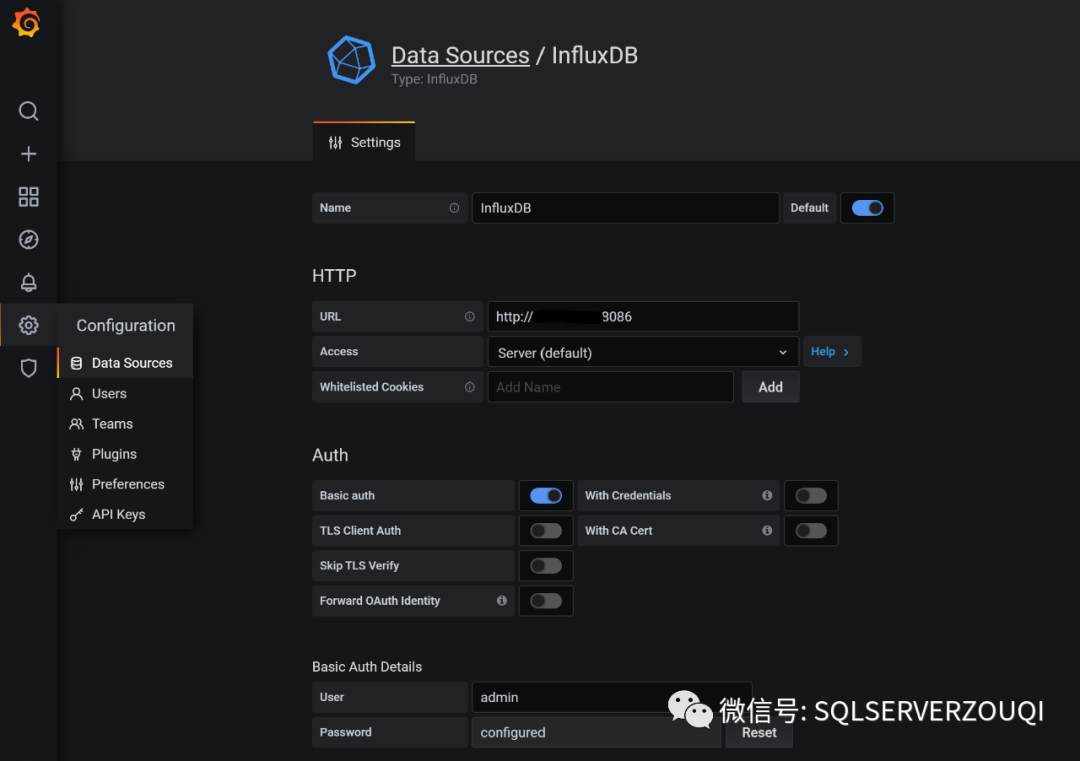
登录Grafana后,在左侧的Configuration->Data Source中配置InfluxDB数据源,填写地址、账号、密码并设置为默认数据源,如下图
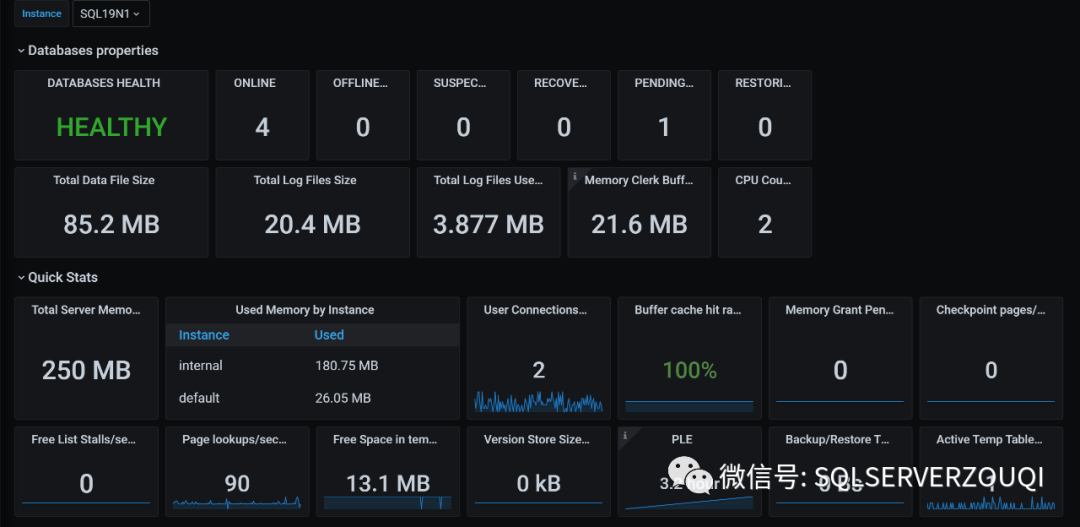
Dashboard,可以自己创建,也可以在采用公开社区的(感谢热心无私的大佬们)。这里,我采用SQL Servers by Jonathan Rioux。这个Dashboard中使用的Piechart不是Grafana预置的,所以还需要安装:
# Grafana所在Host安装,重启服务生效grafana-cli plugins install grafana-piechart-panelsystemctl restart grafana-server.service
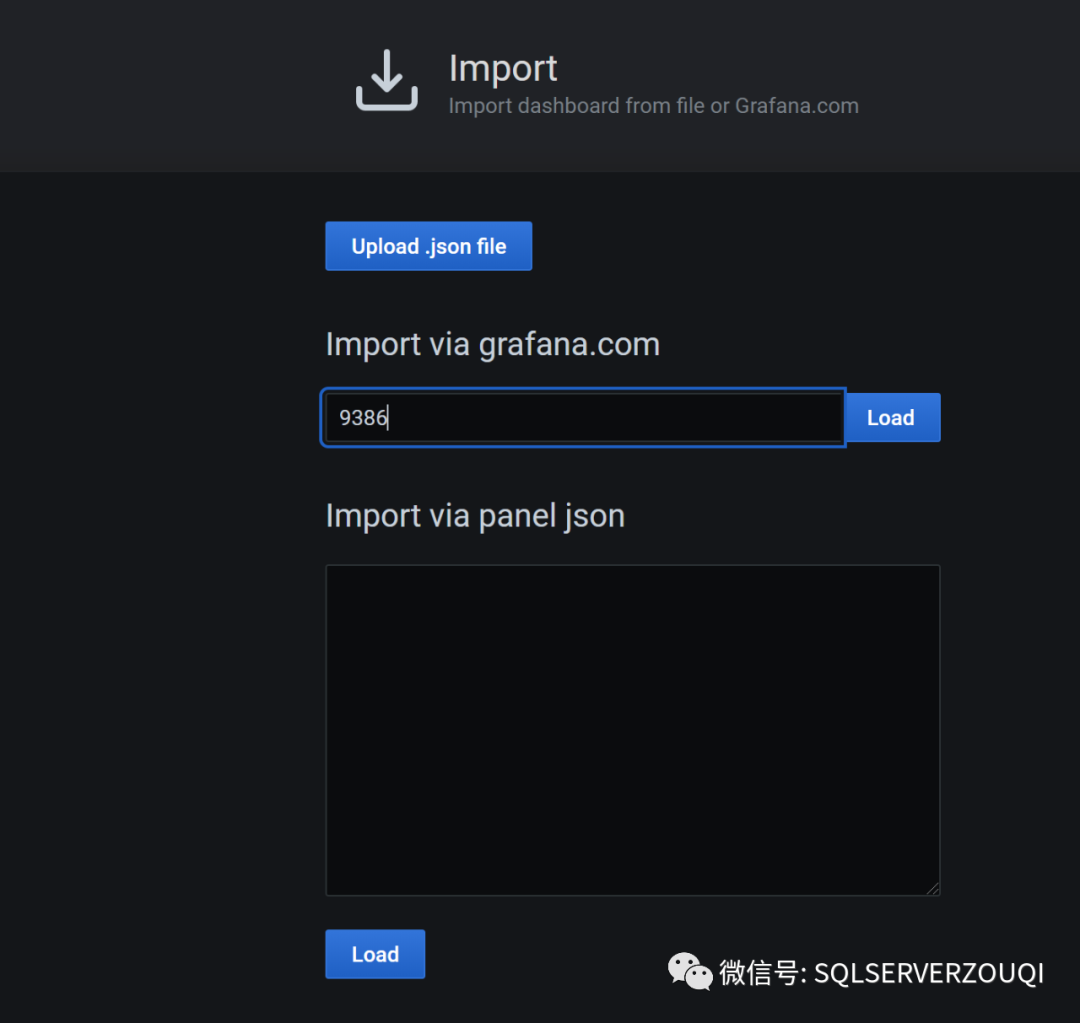
然后在Grafana界面,选择左侧的Dashboard->Import->填入Dashboard ID->Import,如下图:
配置完成后的,可以看这个Dashboard提供的信息还比较丰富的,您也可以根据自己的需要修改和添加相关内容.
总结
实际情况中,自带的数据收集和报表不能完全满足业务需求,自定义的数据收集和自定义的Dashboard,也是非常容易实现的,下次再写
如果已经在使用Zabbix了,Grafana可以直接对接到Zabbix的数据输出。
Telegraf能非常好的支持Cloud环境,下次说说对Azure SQL PaaS的监控
转载自:https://www.cnblogs.com/Joe-T/p/12973362.html
文章经作者授权转载,版权归原文作者所有