


1. 故障现象
客户报2020年7月9号,8点30分左右业务卡顿异常,有几个 insert into 语句的gc等待比较严重,发生业务超时,需要紧急分析一下超时原因,并给出处理建议。
2. AWR分析
由于是业务卡顿分析,可以让客户配合出各节点实例的awr报告辅助分析,另一方面同时进行分析ASH信息:
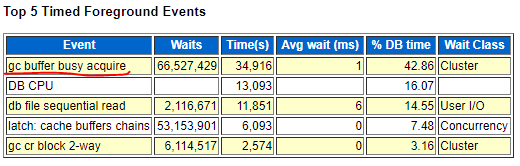
可以看到gc等待排第一位,等待次数异常高。
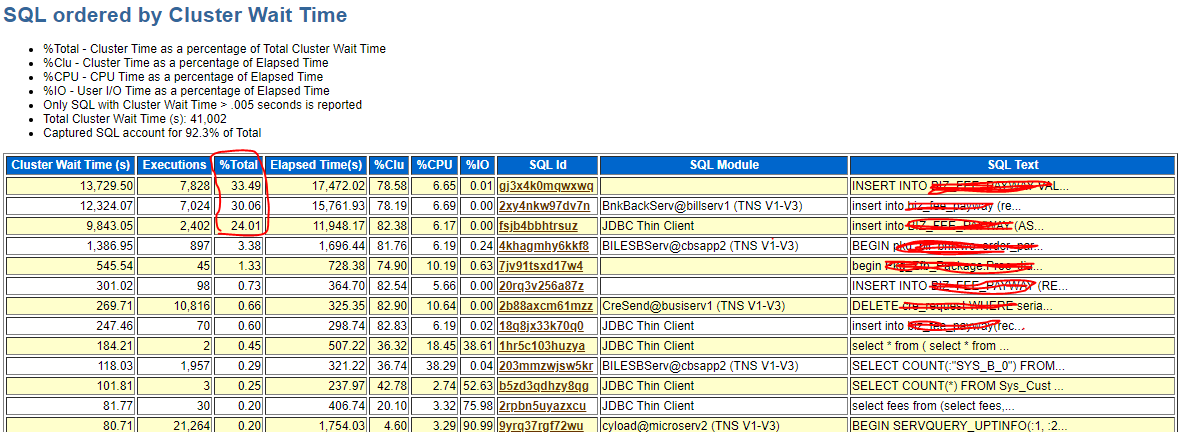
可以看到gc等待主要是由3个insert into语句产生的。
3.诊断分析及建议
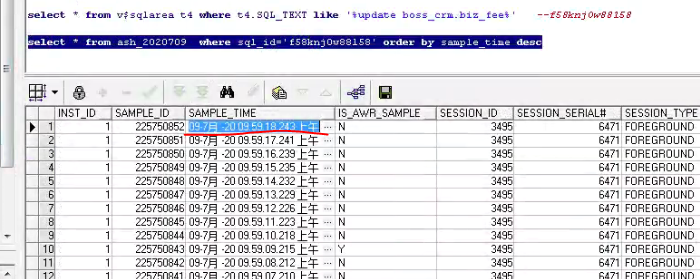
首先先备份ASH表,避免数据被刷出内存:
from gv$active_session_history
 where sample_time >=
       to_date('2020-07-09 08:00:00', 'yyyy-mm-dd hh24:mi:ss')
   and sample_time <
       to_date('2020-07-09 10:00:00', 'yyyy-mm-dd hh24:mi:ss')
其次查询各实例按分为统计单位的等待次数趋势情况:
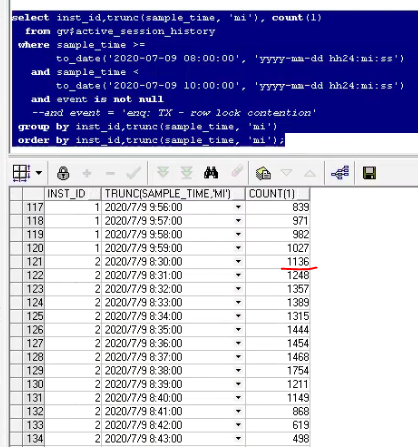
可以发现实例1并没有等待暴增的情况,而实例2在8:30时等待暴示,进一步查询实例2等待次数变化情况:
  from gv$active_session_history
 where sample_time >=
       to_date('2020-07-09 08:00:00', 'yyyy-mm-dd hh24:mi:ss')
   and sample_time <
       to_date('2020-07-09 10:00:00', 'yyyy-mm-dd hh24:mi:ss')
   and event is not null
   and inst_id=1
 group by event
 order by 2 desc;
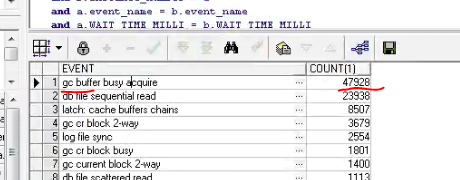
可以看到确实是节点2的GC等待很严重。
进一步查询gc等待严重的sql语句是哪些:
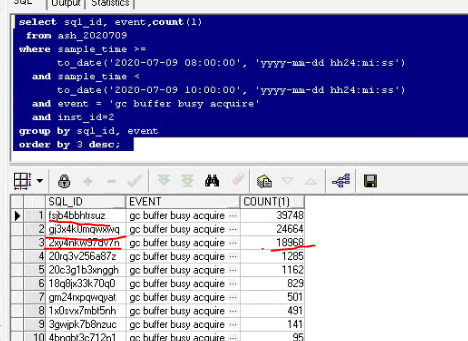
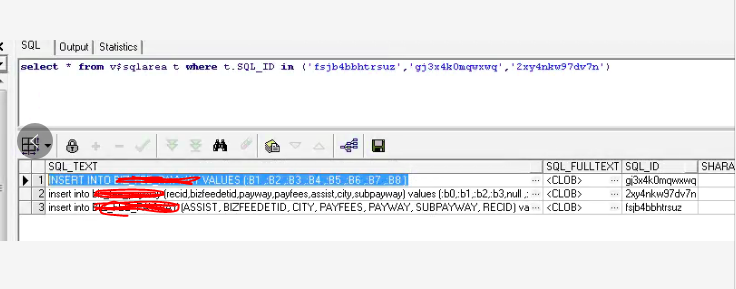
可以看到这三个gc等待严重的SQL语句都是insert into语句,且是插入同一个表。这里和AWR的分析相吻合,进一步查询gc使用块类型占比,考虑如果被用于撤销块比例过多,则应用实例划分可以大大降低GC传输。
       trunc(data_requests / decode(tot_req,0,1), 2) * 100 data_per,  --data blocks
       trunc(undo_requests / decode(tot_req,0,1), 2) * 100 undo_per,  --undo blocks
       trunc(tx_requests / decode(tot_req,0,1), 2) * 100 tx_per,      --undo header blocks
       trunc(other_requests / decode(tot_req,0,1), 2) * 100 other_per --other blocks
  from (select inst_id,
               cr_requests + current_requests tot_req,
               data_requests,
               undo_requests,
               tx_requests,
               other_requests
          from gv$cr_block_server)
 order by inst_id;
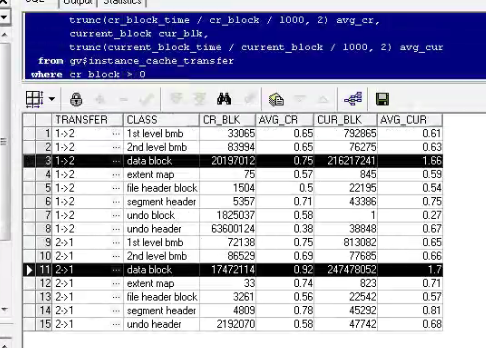
这里除了看到数据块的CR块GC传输比较多,也可以看到undo header的cr块传输占比也很大。进一步查询gc buffer busy acquire等待按块类型分类情况:
 (select *
    from (select /*+ materialize */
           inst_id,
           event,
           current_obj#,
           current_file#,
           current_block#,
           count(*) cnt
            from gv$active_session_history
           where event = 'gc buffer busy acquire'
           group by inst_id,
                    event,
                    current_obj#,
                    current_file#,
                    current_block#
          having count(*) > 5)
   where rownum < 101)
select *
  from (select inst_id,
               owner,
               object_name,
               object_type,
               current_file#,
               current_block#,
               cnt
          from ash_gc a, dba_objects o
         where (a.current_obj# = o.object_id(+))
           and a.current_obj# >= 1
        union
        select inst_id,
               '',
               '',
               'Undo Header/Undo block',
               current_file#,
               current_block#,
               cnt
          from ash_gc a
         where a.current_obj# = 0
        union
        select inst_id,
               '',
               '',
               'Undo Block',
               current_file#,
               current_block#,
               cnt
          from ash_gc a
         where a.current_obj# = -1)
 order by 7 desc
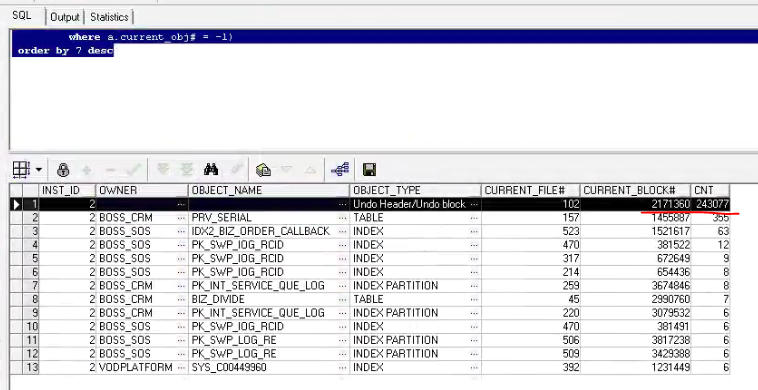
可以看到Undo Header/Undo block的统计次数最大,最严重的GC等待来自undo上的数据块,验证了前面cr块的gc传输很大的情况。由于都是同一个表的gc传输,这时客户开发反馈,昨晚有业务处理
  set a.subpayway ='05'
  where exists (select 1 from t1_20200708 b where a.bizfeedetid = a.bizfeedetid);
但中间杀了没提交,写入表慢是否跟这个有关?
根据这个信息,怀疑是这个UPDATE语句的表数据量很大,执行非常慢才去杀掉的,客户回复可能是没有写好条件,这个SQL等于是更新了整张表,确实是中止了,进行异常回滚而没有正常提交。从SQL写法上(a.bizfeedetid = a.bizfeedetid)也可以看到恒等的错误,查看这个表数据量:
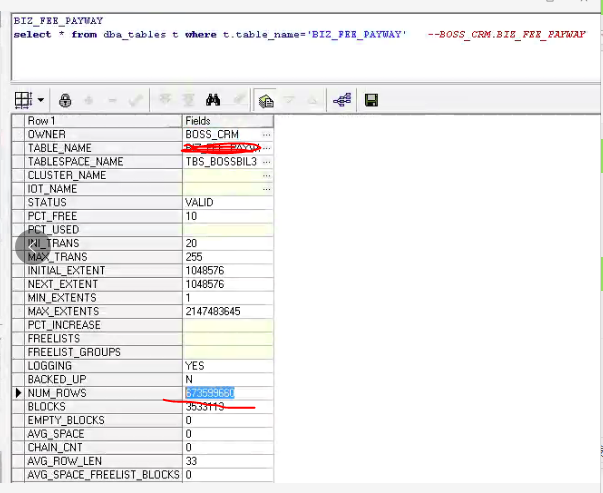
这个表不是分区表,数据量达到6亿多条,update全表根本无法完成。
分析gc buffer busy acquire等待事件:
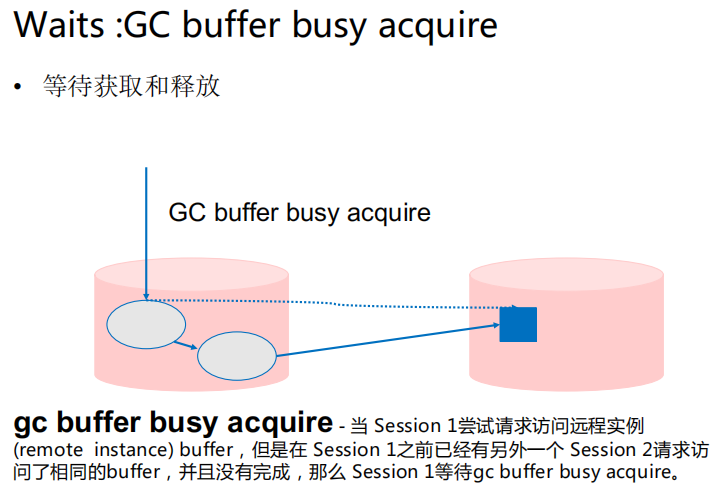
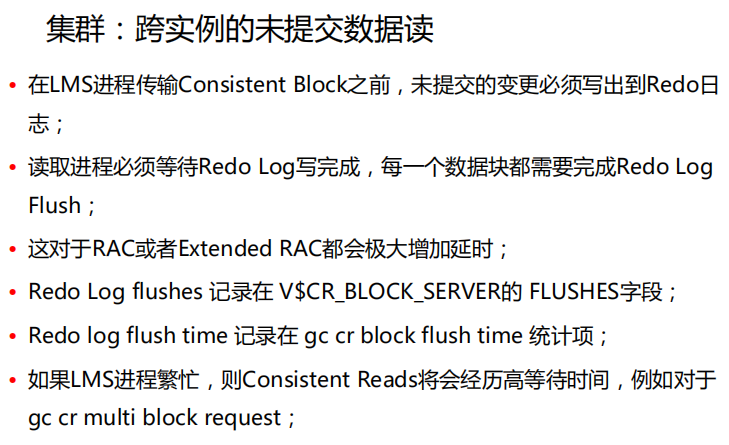
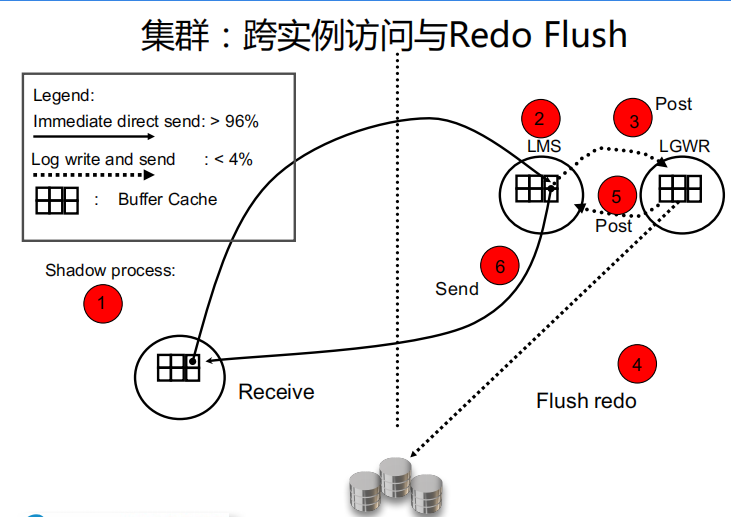
这里可以知道gc buffer busy acquire等待需等待lgwr刷新未提交的变更到日志中,也就需要undo的回滚和一致性要求,根据以往的经验,如果如果lgwr写入慢,则会进一步加重在gc的等待,进一步查看lgwr 的 trace,发现写抖动严重:
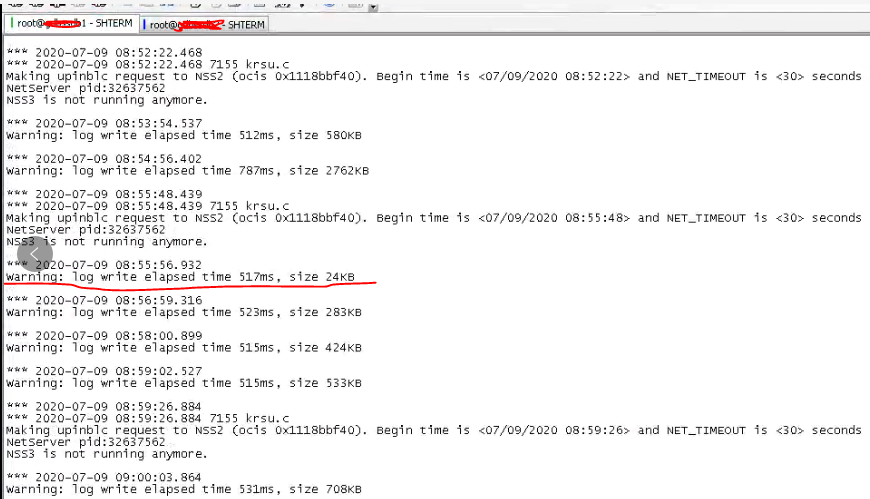
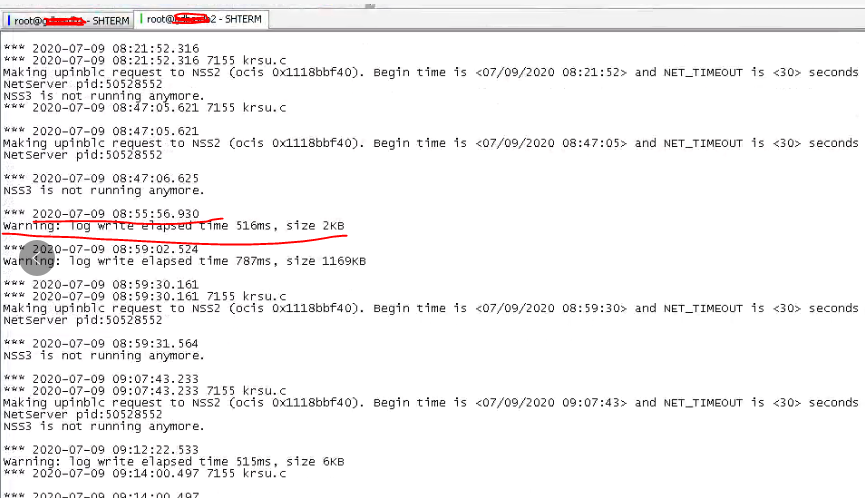
节点1、节点2,也就是实例1、实例2的lgwr写入都存在写入延迟的问题,lgwr写入抖动很严重,2KB都要写516ms,lgwr写入慢,如果碰上大量的gc块获取,就会产生大量的gc等待,这里lgwr刷新需求和lgwr写入慢相应验证插入业务卡顿的故障现象。
继续查log file parallel write直方图:
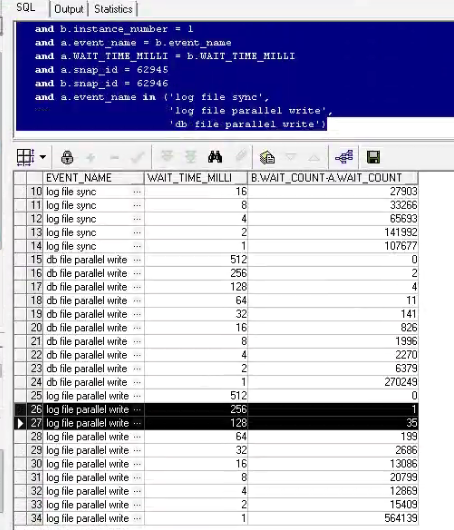
同样验证log写入有比较严重的抖动现象。
可通过v$fast_start_transactions视图查看正在回滚的事务:
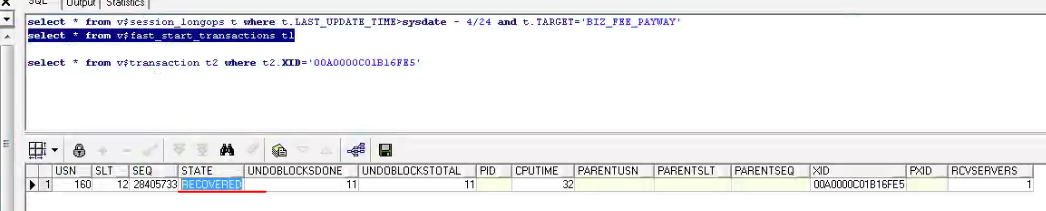
根据XID事务ID已经找不到对应事务了,只有之前完成的回滚。
查询到这条update只在节点1执行,且最后一次执行时间是在09:59分,此时已经11点了,没有查到回滚事务信息,说明已经完成了事务回滚,故障已自动恢复。这里客户反馈库这时latch: cache buffers chains等待严重,查询此时的等待链信息:
with ash as
 (select /*+ materialize*/
   *
    from gv$active_session_history t
   where sample_time >=
         to_date('2020-07-09 11:00:00', 'yyyy-mm-dd hh24:mi:ss')
     and sample_time <
         to_date('2020-07-09 12:00:00', 'yyyy-mm-dd hh24:mi:ss')),
chains as
 (select inst_id,
         blocking_session blocking_sid,
         blocking_session_serial#  blocking_serial,
         session_id,
         session_serial# session_serial,
         level lvl,
         sys_connect_by_path(inst_id||' '||session_id || ',' || session_serial# || ' ' ||
                             sql_id || ' ' || event,
                             ' <-by ') path,
         connect_by_isleaf isleaf
    from ash
   start with event in ('latch: cache buffers chains')
  connect by nocycle(prior blocking_session = session_id
                 and prior blocking_session_serial# = session_serial#
                 and prior sample_id = sample_id))
select inst_id,
       blocking_sid,
       blocking_serial,
       lpad(round(ratio_to_report(count(*)) over() * 100) || '%', 5, ' ') "%This",
       count(*) ash_time,
       path
  from chains
 where isleaf = 1
 group by inst_id,blocking_sid,blocking_serial, path
 order by inst_id,ash_time desc;
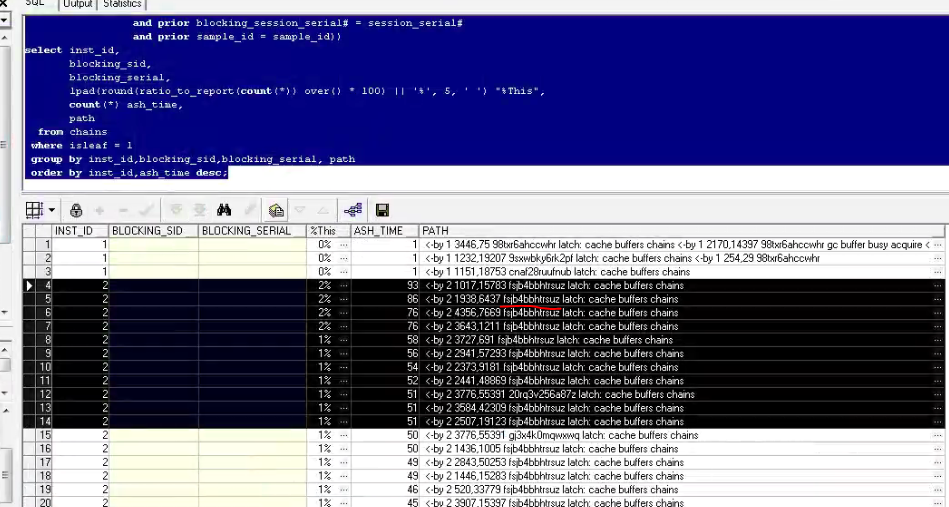
依然是之前一个那个没有分区的6亿条记录表的一条insert语句,只是等待事件由gc变成cbc等待,根据以往处理经验,CBC的等待需要考虑BUFFER不够和访问热点的问题,需要从表结构、表参数、索引设计、索引参数等考虑优化。
客户反馈这个表是一些中间数据,分区标识不明显,所以一直没有进行分区,且对查询要求比较高,还会和三个同等大小的表关联。
针对这种情况,我们给出建议是创建成全局HASH分区表可能较合适的,索引也相应创建成分区索引,需要根据业务再讨论设计。可以先设置pctfree参数缓解CBC。
综合以上的分析,可以确认本次故障是由于开发一条update语句条件错误导致大量的undo事务回滚,使在另一实例上的相同表的几个业务上insert into语句产生大量的gc buffer busy acquire等待,加上lgwr写入抖动加剧了等待时长,最终引起了前台业务卡顿。
4.故障总结
一个update语句写法错误就导致了整个业务系统的务卡顿,说明对大表的DML/DDL操作需要更加慎重,大表操作更加容易导致故障发生,如果语句错误需要及时发现,更早时间介入处理,以避免长时间造成的业务卡顿。
针对本次故障,给予以下几个建议:
1.应用上要尽量避免这样的操作异常造成的大量回滚,针对大表的DML/DDL操作需要更加慎重。
2.为尽量避免GC等待,可以考虑进行应用划分,某个业务功能限制在一个节点中执行。
3.log file parallel write日志写入有严重的延迟,需要存储厂商配合进一步分析。
4.当前大表建议改造为全局HASH分区表可能更合适,索引也相应创建成分区索引,需要根据业务再讨论设计。可以先设置pctfree参数缓解CBC。
