


背景
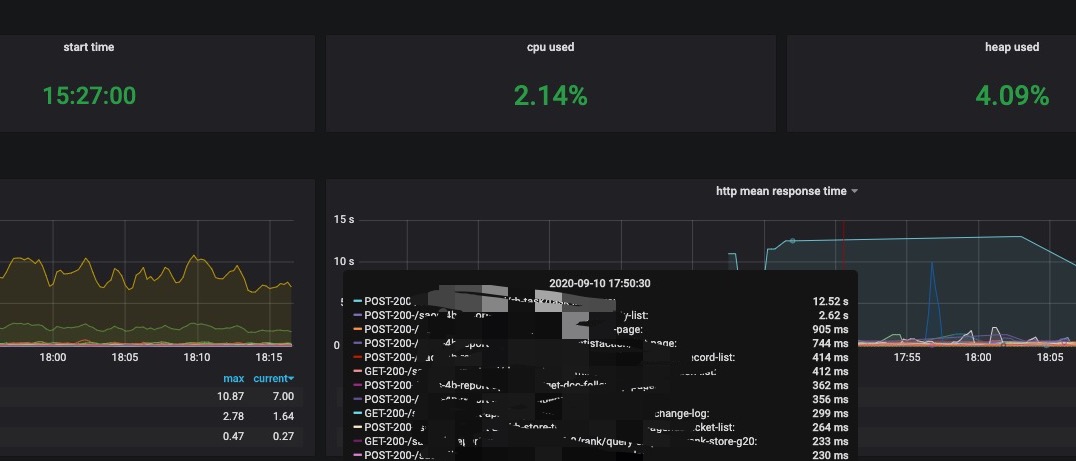
9.10号下午18点多,研发人员反馈有个服务的延时变高了,平时都是2s以下,突然变成了10s多
排查过程
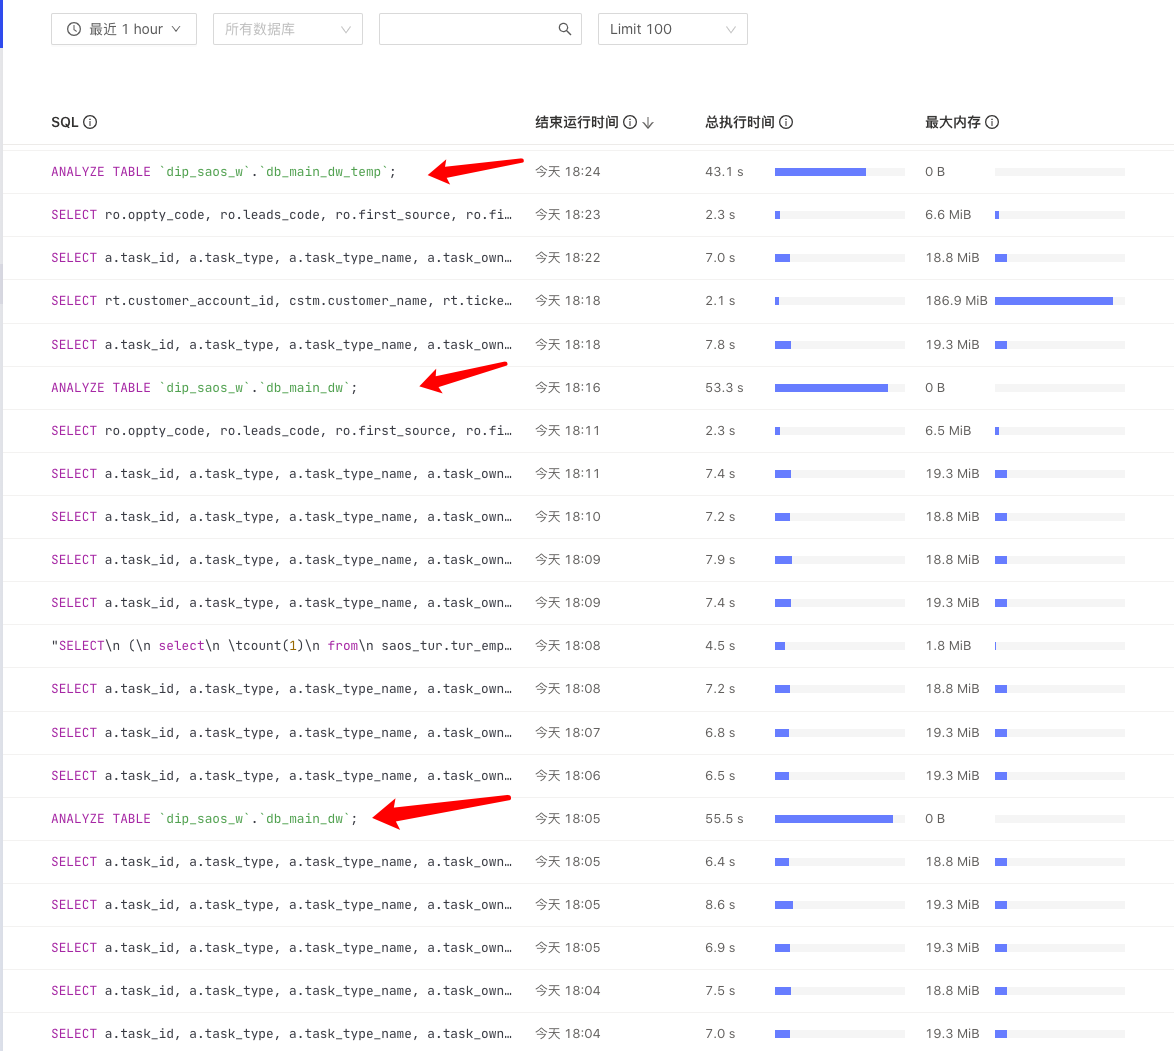
- 登录集群的dashboard,查看集群延时和慢查询确实都升高了,并且业务SQL慢的前后都有
ANALYZE TABLEdip_saos_w.db_main_dw;操作,这个Tidb自动触发的收集更新表的统计信息的操作,如下图:
- 咨询了开发人员,
db_main_dw这个表很早就上了,并且今天也没有做过任何业务上的调整,我试着调整analyze执行的频率,并且手动执行了一下今天变慢的SQL,发现集群在没有做analyze的时候也很慢,入下图:
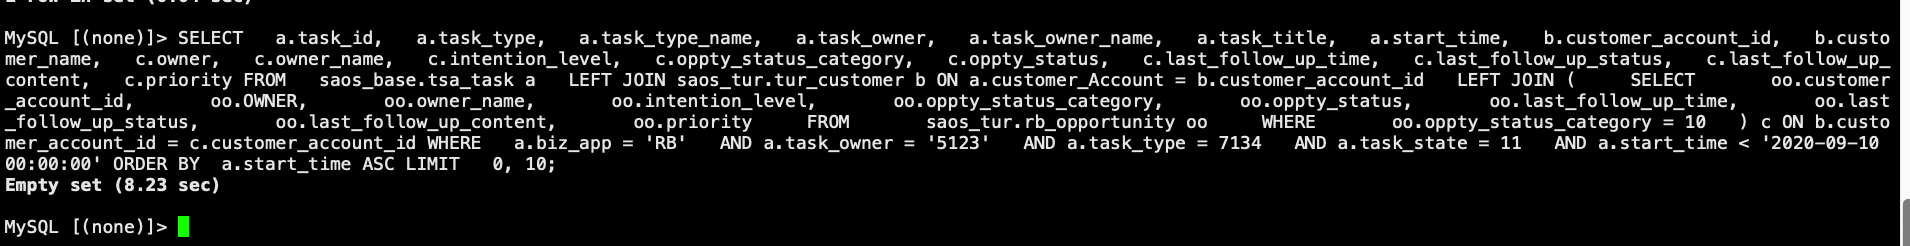
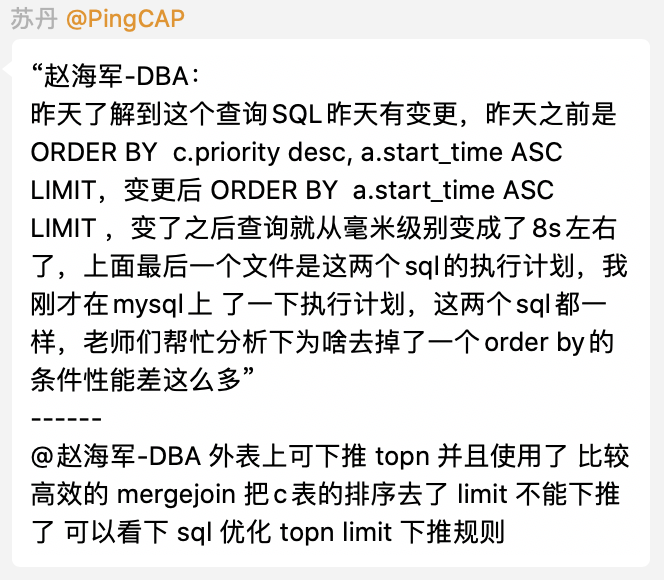
- 接着在群里咨询大家上图变慢的这个SQL今天有没有做过调整,得知下午上过线,这个SQL去掉了一个排序条件,
ORDER BY c.priority desc, a.start_time变成了ORDER BY a.start_time,调整前的SQL如下:
SELECT a.task_id, a.task_type, a.task_type_name, a.task_owner, a.task_owner_name, a.task_title, a.start_time, b.customer_account_id, b.customer_name, c.owner, c.owner_name, c.intention_level, c.oppty_status_category, c.oppty_status, c.last_follow_up_time, c.last_follow_up_status, c.last_follow_up_content, c.priority FROM saos_base.tsa_task a LEFT JOIN saos_tur.tur_customer b ON a.customer_Account = b.customer_account_id LEFT JOIN ( SELECT oo.customer_account_id, oo.OWNER, oo.owner_name, oo.intention_level, oo.oppty_status_category, oo.oppty_status, oo.last_follow_up_time, oo.last_follow_up_status, oo.last_follow_up_content, oo.priority FROM saos_tur.rb_opportunity oo WHERE oo.oppty_status_category = 10 ) c ON b.customer_account_id = c.customer_account_id WHERE a.biz_app = 'RB' AND a.task_owner = '5123' AND a.task_type = 7134 AND a.task_state = 11 AND a.start_time < '2020-09-10 00:00:00' ORDER BY c.priority desc, a.start_time ASC LIMIT 0, 10;
- 然后在PingCAP的技术支持群里咨询各位老师得知,外表上可下推TopN并且使用了比较高效的mergejoin把c表的排序去去掉,limit不能下推到tikv上计算,所以就变慢了
- 那么这个SQL还能再快嘛,8s业务肯定是无法接受的,我想到了用tiflash加速,然后我把这个SQL涉及到的表都开启了tiflash,explain 这个SQL发现查询竟然没有走tiflash,然后我手动设置了session 级别的
set @@session.tidb_isolation_read_engines = "tidb,tiflash";把tikv禁止掉,再次explain 这个SQL都走tiflash了,手动执行时间从8s将到了500ms
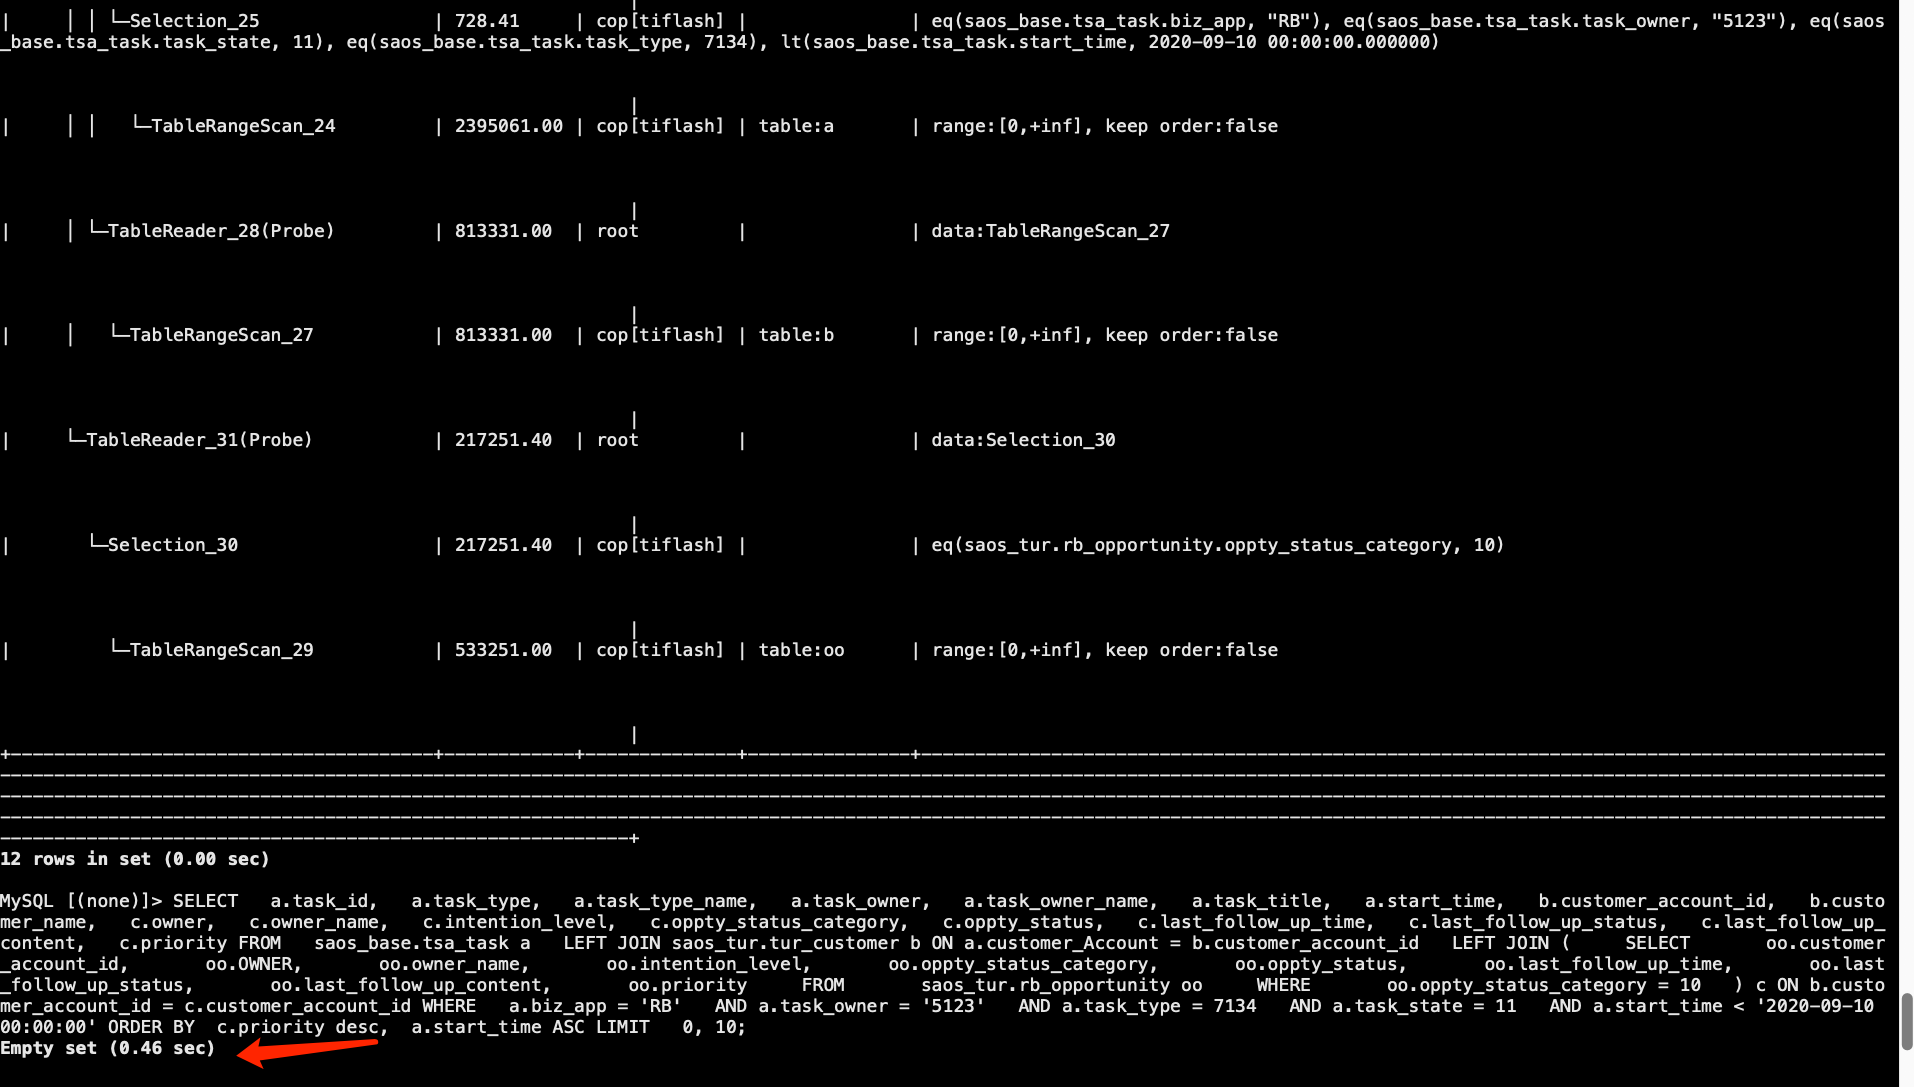
- 既然走tiflash查询效率提升比较明显,那就让开发人员改下SQL,让这个查询强制走tiflash,比较尴尬的是我们按官方文档把SQL调整了还是不能走tiflash,强制走tiflash的SQL如下:
SELECT /*+ read_from_storage(tiflash[a,b]) */ a.task_id, a.task_type, a.task_type_name, a.task_owner, a.task_owner_name, a.task_title, a.start_time, b.customer_account_id, b.customer_name, c.owner, c.owner_name, c.intention_level, c.oppty_status_category, c.oppty_status, c.last_follow_up_time, c.last_follow_up_status, c.last_follow_up_content, c.priority FROM saos_base.tsa_task a LEFT JOIN saos_tur.tur_customer b ON a.customer_Account = b.customer_account_id LEFT JOIN ( SELECT oo.customer_account_id, oo.OWNER, oo.owner_name, oo.intention_level, oo.oppty_status_category, oo.oppty_status, oo.last_follow_up_time, oo.last_follow_up_status, oo.last_follow_up_content, oo.priority FROM saos_tur.rb_opportunity oo WHERE oo.oppty_status_category = 10 ) c ON b.customer_account_id = c.customer_account_id WHERE a.biz_app = 'RB' AND a.task_owner = '5123' AND a.task_type = 7134 AND a.task_state = 11 AND a.start_time < '2020-09-10 00:00:00' ORDER BY c.priority desc, a.start_time ASC LIMIT 0, 10;
- 上面问题反馈给群里PingCAP的技术支持小伙伴们然后继续排查,收集了表的健康度、表的统计信息、统计信息直方图,信息如下:
#表健康度
MySQL [(none)]> SHOW STATS_HEALTHY where Table_name in ( 'tsa_task','tur_customer','rb_opportunity');
+-----------+----------------+----------------+---------+
| Db_name   | Table_name     | Partition_name | Healthy |
+-----------+----------------+----------------+---------+
| saos_base | tsa_task       |                |      51 |
| saos_tur  | tur_customer   |                |      80 |
| saos_tur  | rb_opportunity |                |      72 |
+-----------+----------------+----------------+---------+

#表统计信息
MySQL [(none)]> SHOW stats_meta where Table_name in ( 'tsa_task','tur_customer','rb_opportunity');
+-----------+----------------+----------------+---------------------+--------------+-----------+
| Db_name   | Table_name     | Partition_name | Update_time         | Modify_count | Row_count |
+-----------+----------------+----------------+---------------------+--------------+-----------+
| saos_tur  | tur_customer   |                | 2020-09-11 14:25:23 |       157738 |    795808 |
| saos_tur  | rb_opportunity |                | 2020-09-11 14:27:06 |       144563 |    517778 |
| saos_base | tsa_task       |                | 2020-09-11 14:27:51 |      1112555 |   2311207 |
+-----------+----------------+----------------+---------------------+--------------+-----------+
#统计信息直方图
MySQL [(none)]> SHOW STATS_HISTOGRAMS where Table_name in ( 'tsa_task','tur_customer','rb_opportunity');
+-----------+----------------+----------------+-------------------------------+----------+---------------------+----------------+------------+---------------------+-------------+
| Db_name   | Table_name     | Partition_name | Column_name                   | Is_index | Update_time         | Distinct_count | Null_count | Avg_col_size        | Correlation |
+-----------+----------------+----------------+-------------------------------+----------+---------------------+----------------+------------+---------------------+-------------+
| saos_base | tsa_task       |                | biz_code                      |        0 | 2020-08-13 08:51:18 |        1510400 |          0 |               22.83 |    0.198177 |
| saos_base | tsa_task       |                | task_type                     |        0 | 2020-08-13 08:51:18 |             93 |          0 |                7.37 |   -0.124592 |
| saos_base | tsa_task       |                | create_time                   |        0 | 2020-08-13 08:51:21 |        1309184 |          0 |
+-----------+----------------+----------------+-------------------------------+----------+---------------------+----------------+------------+---------------------+-------------+
65 rows in set (0.00 sec)
- 通过上面信息发现这3个表的健康度都不高,官方建议健康度最好在80以上,所以我们先重新收集下表的统计信息,命令如下:
analyze table tsa_task;
analyze table tur_customer;
analyze table rb_opportunity;
- 然后再次执行发现还是无法走tiflash,但是走tikv变快了,通过执行计划可以看到查询优化器用到了TopN和IndexMergeJoin这两个优化算子,执行计划如下:
explain analyze  SELECT   a.task_id,   a.task_type,   a.task_type_name,   a.task_owner,   a.task_owner_name,   a.task_title,   a.start_time,   b.customer_account_id,   b.customer_name,   c.owner,   c.owner_name,   c.intention_level,   c.oppty_status_category,   c.oppty_status,   c.last_follow_up_time,   c.last_follow_up_status,   c.last_follow_up_content,   c.priority FROM   saos_base.tsa_task a   LEFT JOIN saos_tur.tur_customer b ON a.customer_Account = b.customer_account_id   LEFT JOIN (     SELECT       oo.customer_account_id,       oo.OWNER,       oo.owner_name,       oo.intention_level,       oo.oppty_status_category,       oo.oppty_status,       oo.last_follow_up_time,       oo.last_follow_up_status,       oo.last_follow_up_content,       oo.priority     FROM       saos_tur.rb_opportunity oo     WHERE       oo.oppty_status_category = 10   ) c ON b.customer_account_id = c.customer_account_id WHERE   a.biz_app = 'RB'   AND a.task_owner = '5123'   AND a.task_type = 7134   AND a.task_state = 11   AND a.start_time < '2020-09-10 00:00:00' ORDER BY  c.priority desc,  a.start_time ASC LIMIT   0, 10  \G
*************************** 1. row ***************************
            id: Projection_13
       estRows: 10.00
       actRows: 0
          task: root
 access object:
execution info: time:146.177049ms, loops:1, Concurrency:OFF
 operator info: saos_base.tsa_task.task_id, saos_base.tsa_task.task_type, saos_base.tsa_task.task_type_name, saos_base.tsa_task.task_owner, saos_base.tsa_task.task_owner_name, saos_base.tsa_task.task_title, saos_base.tsa_task.start_time, saos_tur.tur_customer.customer_account_id, saos_tur.tur_customer.customer_name, saos_tur.rb_opportunity.owner, saos_tur.rb_opportunity.owner_name, saos_tur.rb_opportunity.intention_level, saos_tur.rb_opportunity.oppty_status_category, saos_tur.rb_opportunity.oppty_status, saos_tur.rb_opportunity.last_follow_up_time, saos_tur.rb_opportunity.last_follow_up_status, saos_tur.rb_opportunity.last_follow_up_content, saos_tur.rb_opportunity.priority
        memory: 7.62890625 KB
          disk: N/A
*************************** 2. row ***************************
            id: └─TopN_16
       estRows: 10.00
       actRows: 0
          task: root
 access object:
execution info: time:146.17435ms, loops:1
 operator info: saos_tur.rb_opportunity.priority:desc, saos_base.tsa_task.start_time:asc, offset:0, count:10
        memory: 0 Bytes
          disk: N/A
*************************** 3. row ***************************
            id:   └─IndexMergeJoin_31
       estRows: 762.40
       actRows: 0
          task: root
 access object:
execution info: time:146.13307ms, loops:2, Concurrency:OFF
 operator info: left outer join, inner:Projection_29, outer key:saos_tur.tur_customer.customer_account_id, inner key:saos_tur.rb_opportunity.customer_account_id
        memory: 0 Bytes
          disk: N/A
*************************** 4. row ***************************
            id:     ├─IndexMergeJoin_46(Build)
       estRows: 735.86
       actRows: 0
          task: root
 access object:
execution info: time:146.13931ms, loops:1, Concurrency:OFF
 operator info: left outer join, inner:Projection_44, outer key:saos_base.tsa_task.customer_account, inner key:saos_tur.tur_customer.customer_account_id
        memory: 0 Bytes
          disk: N/A
*************************** 5. row ***************************
            id:     │ ├─IndexLookUp_69(Build)
       estRows: 730.81
       actRows: 0
          task: root
 access object:
execution info: time:147.392197ms, loops:1, rpc num: 1, rpc time:12.901444ms, proc keys:20185
 operator info:
        memory: 464 KB
          disk: N/A
*************************** 6. row ***************************
            id:     │ │ ├─IndexRangeScan_66(Build)
       estRows: 20967.69
       actRows: 20174
          task: cop[tikv]
 access object: table:a, index:idx_owner(task_owner)
execution info: time:11ms, loops:24
 operator info: range:["5123","5123"], keep order:false
        memory: N/A
          disk: N/A
*************************** 7. row ***************************
            id:     │ │ └─Selection_68(Probe)
       estRows: 730.81
       actRows: 0
          task: cop[tikv]
 access object:
execution info: proc max:96ms, min:17ms, p80:72ms, p95:96ms, iters:69, tasks:11
 operator info: eq(saos_base.tsa_task.biz_app, "RB"), eq(saos_base.tsa_task.task_state, 11), eq(saos_base.tsa_task.task_type, 7134), lt(saos_base.tsa_task.start_time, 2020-09-10 00:00:00.000000)
        memory: N/A
          disk: N/A
*************************** 8. row ***************************
            id:     │ │   └─TableRowIDScan_67
       estRows: 20967.69
       actRows: 20174
          task: cop[tikv]
 access object: table:a
execution info: proc max:96ms, min:17ms, p80:72ms, p95:96ms, iters:69, tasks:11
 operator info: keep order:false
        memory: N/A
          disk: N/A
*************************** 9. row ***************************
            id:     │ └─Projection_44(Probe)
       estRows: 1.00
       actRows:
          task: root
 access object:
execution info: time:0ns, loops:0
 operator info: saos_tur.tur_customer.customer_name, saos_tur.tur_customer.customer_account_id
        memory: N/A
          disk: N/A
*************************** 10. row ***************************
            id:     │   └─IndexLookUp_43
       estRows: 1.00
       actRows:
          task: root
 access object:
execution info: time:0ns, loops:0
 operator info:
        memory: N/A
          disk: N/A
*************************** 11. row ***************************
            id:     │     ├─IndexRangeScan_41(Build)
       estRows: 1.00
       actRows:
          task: cop[tikv]
 access object: table:b, index:uniq_customeraccountid(customer_account_id)
execution info: time:0ns, loops:0
 operator info: range: decided by [eq(saos_tur.tur_customer.customer_account_id, saos_base.tsa_task.customer_account)], keep order:true
        memory: N/A
          disk: N/A
*************************** 12. row ***************************
            id:     │     └─TableRowIDScan_42(Probe)
       estRows: 1.00
       actRows:
          task: cop[tikv]
 access object: table:b
execution info: time:0ns, loops:0
 operator info: keep order:false
        memory: N/A
          disk: N/A
*************************** 13. row ***************************
            id:     └─Projection_29(Probe)
       estRows: 1.04
       actRows:
          task: root
 access object:
execution info: time:0ns, loops:0
 operator info: saos_tur.rb_opportunity.customer_account_id, saos_tur.rb_opportunity.owner, saos_tur.rb_opportunity.owner_name, saos_tur.rb_opportunity.oppty_status_category, saos_tur.rb_opportunity.oppty_status, saos_tur.rb_opportunity.priority, saos_tur.rb_opportunity.last_follow_up_time, saos_tur.rb_opportunity.last_follow_up_content, saos_tur.rb_opportunity.last_follow_up_status, saos_tur.rb_opportunity.intention_level
        memory: N/A
          disk: N/A
*************************** 14. row ***************************
            id:       └─IndexLookUp_28
       estRows: 1.04
       actRows:
          task: root
 access object:
execution info: time:0ns, loops:0
 operator info:
        memory: N/A
          disk: N/A
*************************** 15. row ***************************
            id:         ├─IndexRangeScan_25(Build)
       estRows: 2.54
       actRows:
          task: cop[tikv]
 access object: table:oo, index:idx_customer_account_id(customer_account_id)
execution info: time:0ns, loops:0
 operator info: range: decided by [eq(saos_tur.rb_opportunity.customer_account_id, saos_tur.tur_customer.customer_account_id)], keep order:true
        memory: N/A
          disk: N/A
*************************** 16. row ***************************
            id:         └─Selection_27(Probe)
       estRows: 1.04
       actRows:
          task: cop[tikv]
 access object:
execution info: time:0ns, loops:0
 operator info: eq(saos_tur.rb_opportunity.oppty_status_category, 10)
        memory: N/A
          disk: N/A
*************************** 17. row ***************************
            id:           └─TableRowIDScan_26
       estRows: 2.54
       actRows:
          task: cop[tikv]
 access object: table:oo
execution info: time:0ns, loops:0
 operator info: keep order:false
        memory: N/A
          disk: N/A
17 rows in set (0.15 sec)
- 至此,我们业务的问题解决了(查询快了),但是改写SQL让其强制走tiflash不生效的问题还没结论,最后经过PingCAP后台小伙伴确认还是我们的写法问题,这个SQL涉及到的表不在同一个db里面,所以强制走tiflash的写法需要指定db,即
/*+ read_from_storage(tiflash[a,b]) */改成/*+ read_from_storage(tiflash[saos_base.a, saos_tur.b]) */就可以了,当然了这个问题在官方文档里面并没有写清楚,官方后面会完善使用手册,增加这个场景的说明。
PS:
TiFlash hint不生效的情况还有两种:
1.低于5.7.7的版本要加上–comments才能让hint生效,MySQL 命令行客户端在 5.7.7 版本之前默认清除了 Optimizer Hints。如果需要在这些早期版本的客户端中使用 Hint 语法,需要在启动客户端时加上 --comments 选项;
2.如果表使用了别名,那么hint里也要使用别名才能生效
总结
-
查看表的总行数以及修改的行数等信息
SHOW stats_meta where Table_name = ‘tablename’ -
查看表的健康度
通过 SHOW STATS_HEALTHY 可以查看表的统计信息健康度,并粗略估计表上统计信息的准确度。当 modify_count >= row_count 时,健康度为 0;当 modify_count < row_count 时,健康度为 (1 - modify_count/row_count) * 100
- 自动触发表统计信息更新的条件
- 触发策略:新表达到1000条,并且在1分钟内没有写入,会自动触发。
- 当表的(修改数/当前总行数,这个数据对应state_meta里面total和modify)大于
tidb_auto_analyze_ratio的时候,会自动触发 analyze语句。tidb_auto_analyze_ratio的默认值为0.5,即默认开启此功能。为了保险起见,在开启此功能的时候,保证了其最小值为0.3。但是不能大于等于pseudo-estimate-ratio(默认值为 0.8),否则会有一段时间使用pseudo统计信息,建议设置值为0.5。
- 查看tidb目前支持的读引擎以及修改session级别的读引擎
#修改回话级别的读引擎,下面这个设置是禁止读tikv,需要确保查询的表都已经同步到tiflash,不然查询会报错
MySQL [(none)]> set @@session.tidb_isolation_read_engines = "tidb,tiflash";
Query OK, 0 rows affected (0.00 sec)
#查看目前支持的读引擎
MySQL [(none)]> show variables like 'tidb_isolation_read_engines';
+-----------------------------+--------------+
| Variable_name               | Value        |
+-----------------------------+--------------+
| tidb_isolation_read_engines | tidb,tiflash |
+-----------------------------+--------------+
1 row in set (0.01 sec)
- 手动更新表统计信息的方法,更多细节和使用方法见手动更新表统计信息
ANALYZE table Tablename;
- Tidb虽然高度兼容Mysql,但是有些用法和Mysql还是不一样的,包括SQL优化,下面是SQL优化相关的原理文章,要想把Tidb用好,SQL的优化这块还需要从原理方面深入学习,SQL优化原理相关
写在最后
特别感谢PingCAP的小伙伴们的大力支持,每次遇到问题会帮忙积极主动跟进处理,再次感谢仲舒、贤净、苏丹、振姣。
更多学习和交流可以关注我公众号:

最后修改时间:2020-09-21 16:21:39
「喜欢这篇文章,您的关注和赞赏是给作者最好的鼓励」
关注作者
【版权声明】本文为墨天轮用户原创内容,转载时必须标注文章的来源(墨天轮),文章链接,文章作者等基本信息,否则作者和墨天轮有权追究责任。如果您发现墨天轮中有涉嫌抄袭或者侵权的内容,欢迎发送邮件至:contact@modb.pro进行举报,并提供相关证据,一经查实,墨天轮将立刻删除相关内容。
