


[root@k8s2 postgresql-12.10]# yum install llvm5.0 llvm5.0-devel clang[root@k8s2 postgresql-12.10]# ./configure --prefix=/opt/pg12 --with-llvm LLVM_CONFIG='/usr/bin/llvm-config-5.0-64'[root@k8s2 postgresql-12.10]# make world[root@k8s2 postgresql-12.10]# make install-world[pg12@k8s2 ~]$ initdb -D /opt/pg12/pgdata --data-checksums -A scram-sha-256 -W[pg12@k8s2 ~]$ pg_ctl -D /opt/pg12/pgdata -l logfile start
[pg12@k8s2 ~]$ cat /opt/pg12/pgdata/postgresql.conf |grep jit#jit_above_cost = 100000 # perform JIT compilation if available#jit_inline_above_cost = 500000 # inline small functions if query is#jit_optimize_above_cost = 500000 # use expensive JIT optimizations if#jit = on # allow JIT compilation#jit_provider = 'llvmjit' # JIT library to use[pg12@k8s2 ~]$
创建测试表postgres=# CREATE TABLE t_jit AS SELECT (random()*10000)::int AS x, (random()*100000)::int AS y,(random()*1000000)::int AS z FROM generate_series(1, 50000000) AS id;查看不使用jit的执行计划postgres=# set jit to off;SETpostgres=# explain (analyze , buffers , costs , timing) select count(*) from t_jit; QUERY PLAN------------------------------------------------------------------------------------------------------------------------------------------------ Finalize Aggregate (cost=531688.59..531688.60 rows=1 width=8) (actual time=6404.323..6410.829 rows=1 loops=1) Buffers: shared hit=16194 read=254077 -> Gather (cost=531688.38..531688.58 rows=2 width=8) (actual time=6404.131..6410.818 rows=3 loops=1) Workers Planned: 2 Workers Launched: 2 Buffers: shared hit=16194 read=254077 -> Partial Aggregate (cost=530688.38..530688.39 rows=1 width=8) (actual time=6363.242..6363.243 rows=1 loops=3) Buffers: shared hit=16194 read=254077 -> Parallel Seq Scan on t_jit (cost=0.00..478604.90 rows=20833390 width=0) (actual time=0.091..4547.032 rows=16666667 loops=3) Buffers: shared hit=16194 read=254077 Planning Time: 0.198 ms Execution Time: 6410.929 ms(12 rows)postgres=#查看好用jit的执行计划postgres=# set jit to on;SETpostgres=# explain (analyze , buffers , costs , timing) select count(*) from t_jit; QUERY PLAN------------------------------------------------------------------------------------------------------------------------------------------------ Finalize Aggregate (cost=531688.59..531688.60 rows=1 width=8) (actual time=4927.375..4933.406 rows=1 loops=1) Buffers: shared hit=16208 read=254063 -> Gather (cost=531688.38..531688.58 rows=2 width=8) (actual time=4927.085..4933.384 rows=3 loops=1) Workers Planned: 2 Workers Launched: 2 Buffers: shared hit=16208 read=254063 -> Partial Aggregate (cost=530688.38..530688.39 rows=1 width=8) (actual time=4906.512..4906.513 rows=1 loops=3) Buffers: shared hit=16208 read=254063 -> Parallel Seq Scan on t_jit (cost=0.00..478604.90 rows=20833390 width=0) (actual time=0.047..3677.157 rows=16666667 loops=3) Buffers: shared hit=16208 read=254063 Planning Time: 0.082 ms JIT: Functions: 8 Options: Inlining true, Optimization true, Expressions true, Deforming true Timing: Generation 1.535 ms, Inlining 0.397 ms, Optimization 18.182 ms, Emission 21.841 ms, Total 41.955 ms Execution Time: 4933.971 ms(16 rows)postgres=#在这种情况下,您可以看到查询比以前快 20%以上,这已经是很不错了。


新闻|Babelfish使PostgreSQL直接兼容SQL Server应用程序
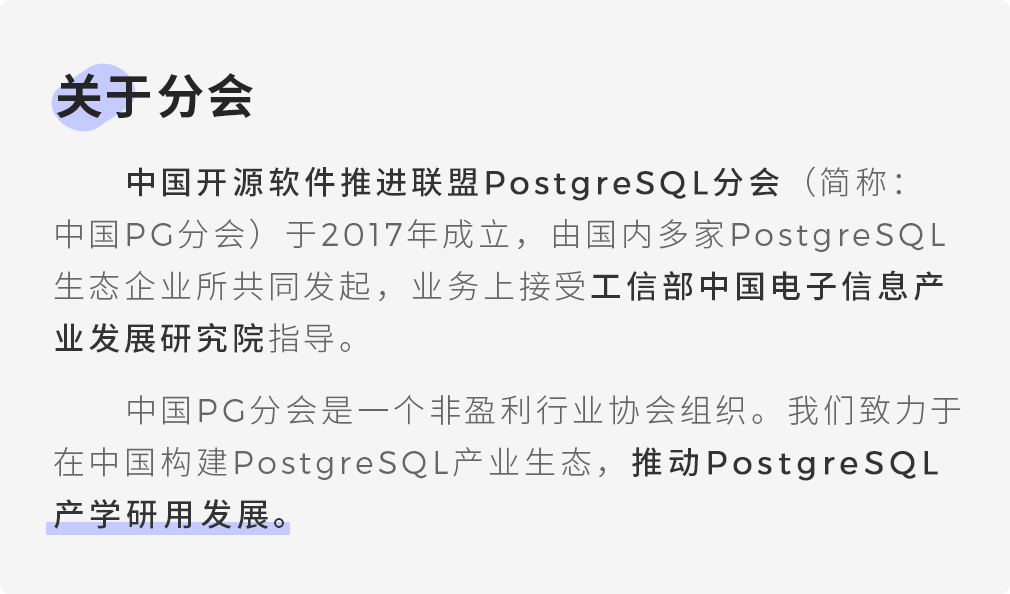
中国PostgreSQL分会入选工信部重点领域人才能力评价机构

更多新闻资讯,行业动态,技术热点,请关注中国PostgreSQL分会官方网站
https://www.postgresqlchina.com
中国PostgreSQL分会生态产品
https://www.pgfans.cn
中国PostgreSQL分会资源下载站
https://www.postgreshub.cn

点击此处阅读原文
↓↓↓
文章转载自开源软件联盟PostgreSQL分会,如果涉嫌侵权,请发送邮件至:contact@modb.pro进行举报,并提供相关证据,一经查实,墨天轮将立刻删除相关内容。
