本篇文章为 TiDB 查询优化及调优系列的最终篇,主要汇集了一些用户常见的 SQL 优化案例,从背景、分析、影响、建议、实操几个角度进行解析。关于 SQL 调优原理的介绍见前面章节。
相关阅读:
案例 1: Delete 涉及数据量过大导致 OOM
MySQL [db_stat]> explain delete from t_stat where imp_date<='20200202';
+---------------------+--------------+------+------------------------------------------------------+
| id                  | count        | task | operator info                                        |
+---------------------+--------------+------+------------------------------------------------------+
| TableReader_6       | 220895815.00 | root | data:Selection_5                                     |
| └─Selection_5       | 220895815.00 | cop  | le(db_stat.t_stat.imp_date, "20200202")              |
|   └─TableScan_4     | 220895815.00 | cop  | table:t_stat, range:[-inf,+inf], keep order:false    |
+---------------------+--------------+------+------------------------------------------------------+
3 rows in set (0.00 sec)
MySQL [db_stat]> select count(*)  from t_stat where imp_date<='20200202';
+-----------+
| count(*)  |
+-----------+
| 184340473 |
+-----------+
1 row in set (17.88 sec)
背景
分析
imp_date
字段上虽然有索引,但是扫描的时间范围过大,无论优化器选择 IndexScan 还是 Table Scan,TiDB 都要向 TiKV Coprocessor 请求读取大量的数据。
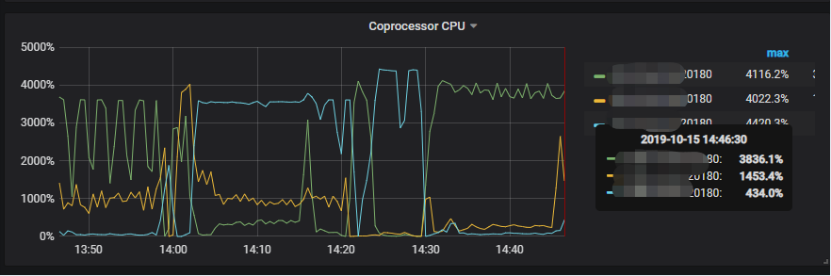
影响
TiKV 节点 Coprocessor CPU 使用率快速上涨;
执行 Delete 操作的 TiDB 节点内存占用快速上涨,因为要将大批量数据加载到 TiDB 内存。
建议
删除数据时,缩小数据筛选范围,或者加上 limit N 每次删除一批数据;
建议使用 Range 分区表,按照分区快速删除。
案例 2:执行计划不稳定导致查询延迟增加
MySQL [db_stat]> explain SELECT * FROM `tbl_article_check_result` `t` WHERE (articleid = '20190925A0PYT800') ORDER BY checkTime desc LIMIT 100 ;
+--------------------------+----------+------+-------------------------------------------------------------------------------------------------------------------------------------------------------------------------------------------------------------------------------------------------------------------------------------------------------------------------------------------------------------------------------+
| id                       | count    | task | operator info                                                                                                                                                                                                                                                                                                                                                                 |
+--------------------------+----------+------+-------------------------------------------------------------------------------------------------------------------------------------------------------------------------------------------------------------------------------------------------------------------------------------------------------------------------------------------------------------------------------+
| Projection_7             | 100.00   | root | db_stat.t.type, db_stat.t.articleid, db_stat.t.docid, db_stat.t.version, db_stat.t.checkid, db_stat.t.checkstatus, db_stat.t.seclevel, db_stat.t.t1checkstatus, db_stat.t.t2checkstatus, db_stat.t.mdaichannel, db_stat.t.mdaisubchannel, db_stat.t.checkuser, db_stat.t.checktime, db_stat.t.addtime, db_stat.t.havegot, db_stat.t.checkcode                                 |
| └─Limit_12               | 100.00   | root | offset:0, count:100                                                                                                                                                                                                                                                                                                                                                           |
|   └─IndexLookUp_34       | 100.00   | root |                                                                                                                                                                                                                                                                                                                                                                               |
|     ├─IndexScan_31       | 30755.49 | cop  | table:t, index:checkTime, range:[NULL,+inf], keep order:true, desc                                                                                                                                                                                                                                                                                                            |
|     └─Selection_33       | 100.00   | cop  | eq(db_dayu_1.t.articleid, "20190925A0PYT800")                                                                                                                                                                                                                                                                                                                                 |
|       └─TableScan_32     | 30755.49 | cop  | table:tbl_article_check_result, keep order:false                                                                                                                                                                                                                                                                                                                              |
+--------------------------+----------+------+-------------------------------------------------------------------------------------------------------------------------------------------------------------------------------------------------------------------------------------------------------------------------------------------------------------------------------------------------------------------------------+
6 rows in set (0.00 sec)
背景
articleid和
checkTime字段上分别建有单列索引,正常情况下走
articleid上的索引比较快,偶尔执行计划不稳定时走
checkTime上的索引,导致查询延迟达到分钟级别。
分析
LIMIT 100限定了获取 100 条记录,如果
checkTime和
articleid列之间的相关度不高,在独立性假设失效时,优化器估算走
checkTime上的索引并满足
articleid条件时扫描的行数,可能比走
articleid上的索引扫描的行数更少。
影响
建议
手动 analyze table,配合 crontab 定期 analyze,维持统计信息准确度;
自动 auto analyze,调低 analyze ratio 阈值,提高收集频次,并设置运行时间窗口;
set global tidb_auto_analyze_ratio=0.2;
set global tidb_auto_analyze_start_time='00:00 +0800';
set global tidb_auto_analyze_end_time='06:00 +0800';
业务修改 SQL ,使用 force index 固定使用 articleid 列上的索引;
业务可以不用修改 SQL,使用 SPM (见上述章节)的 create binding 创建 force index 的绑定 SQL,可以避免执行计划不稳定导致的性能下降。
案例 3:查询字段与值的数据类型不匹配
MySQL [db_stat]> explain select * from t_like_list where person_id=1535538061143263;
+---------------------+------------+------+-----------------------------------------------------------------------------------+
| id                  | count      | task | operator info                                                                     |
+---------------------+------------+------+-----------------------------------------------------------------------------------+
| Selection_5         | 1430690.40 | root | eq(cast(db_stat.t_like_list.person_id), 1.535538061143263e+15)                    |
| └─TableReader_7     | 1788363.00 | root | data:TableScan_6                                                                  |
|   └─TableScan_6     | 1788363.00 | cop  | table:t_like_list, range:[-inf,+inf], keep order:false                            |
+---------------------+------------+------+-----------------------------------------------------------------------------------+
3 rows in set (0.00 sec)
背景
person_id列上建有索引且选择性较好,但执行计划没有按预期走
IndexScan。
分析
person_id是字符串类型,但是存储的值都是数字,业务认为可以直接赋值;而优化器需要在字段上做 cast 类型转换,导致无法使用索引。
建议
where条件的值加上引号,之后执行计划使用了索引:
MySQL [db_stat]> explain select * from table:t_like_list where person_id='1535538061143263';
+-------------------+-------+------+----------------------------------------------------------------------------------------------------------+
| id                | count | task | operator info                                                                                            |
+-------------------+-------+------+----------------------------------------------------------------------------------------------------------+
| IndexLookUp_10    | 0.00  | root |                                                                                                          |
| ├─IndexScan_8     | 0.00  | cop  | table:t_like_list, index:person_id, range:["1535538061143263","1535538061143263"], keep order:false      |
| └─TableScan_9     | 0.00  | cop  | table:t_like_list, keep order:false                                                                      |
+-------------------+-------+------+----------------------------------------------------------------------------------------------------------+
3 rows in set (0.00 sec)
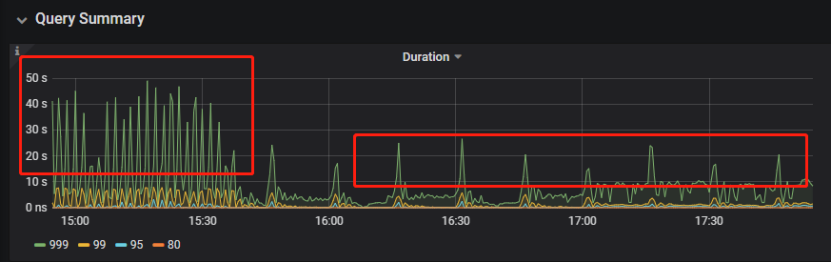
案例 4:读热点导致 SQL 延迟增加
背景
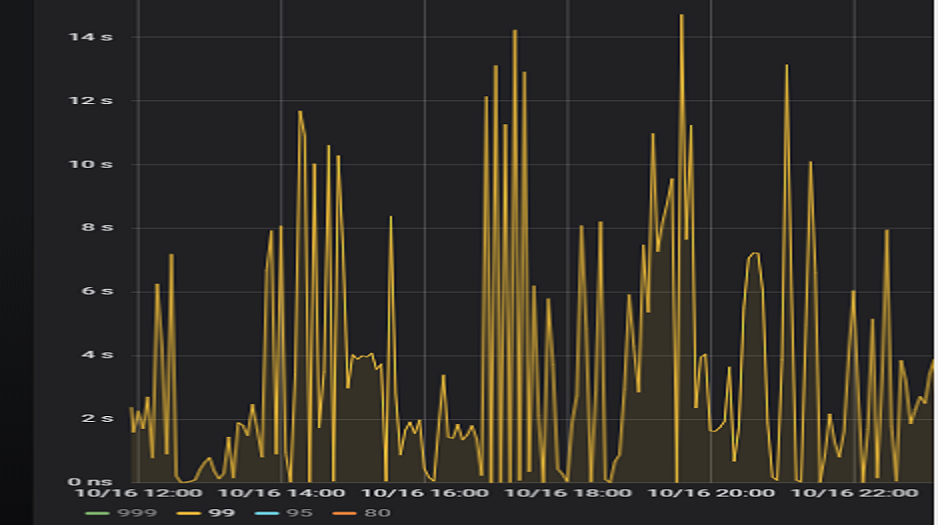
慢查询日志分析
./pt-query-digest tidb_slow_query.log > result
Process keys和
Process time并不是线性相关,
Process keys数量多的 SQL 的
Process time处理时间不一定更长,如下面 SQL 的
Process keys为 22.09M,
Process time为 51s。
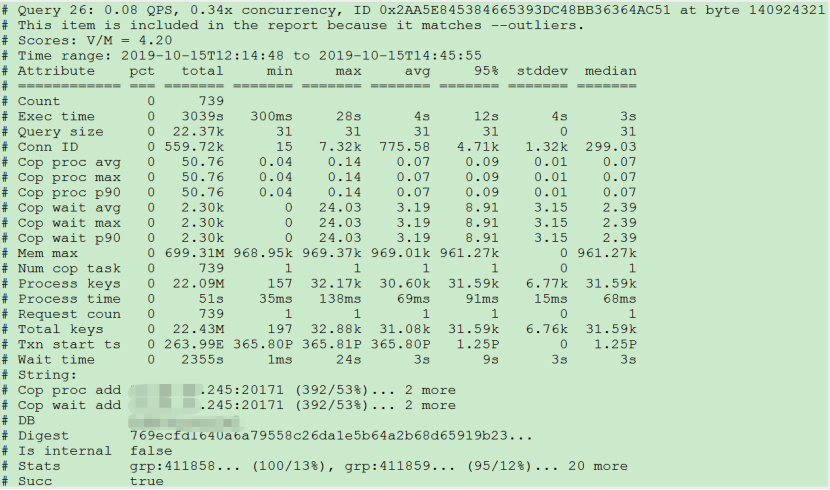
Process keys为 12.68M,但是
Process time高达 142353s。
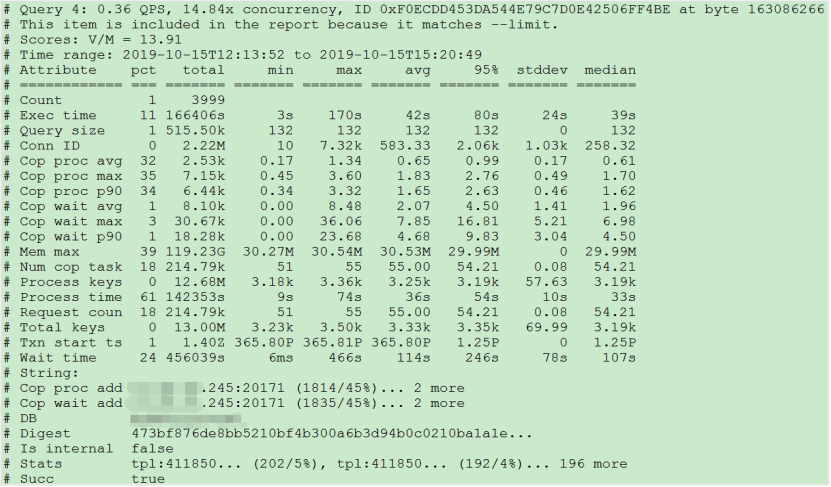
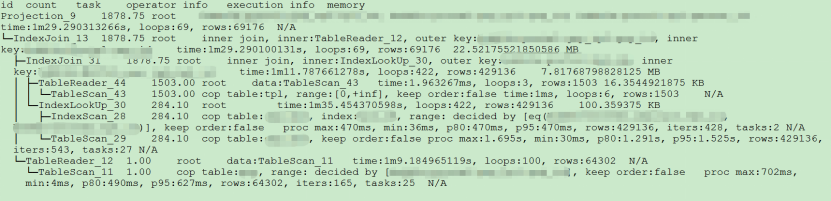
Process time较多的 SQL,发现 3 个典型的 slow query,分析具体的执行计划。
select a.a_id, a.b_id,uqm.p_id from a join hsq on a.b_id=hsq.id join uqm on a.a_id=uqm.id;
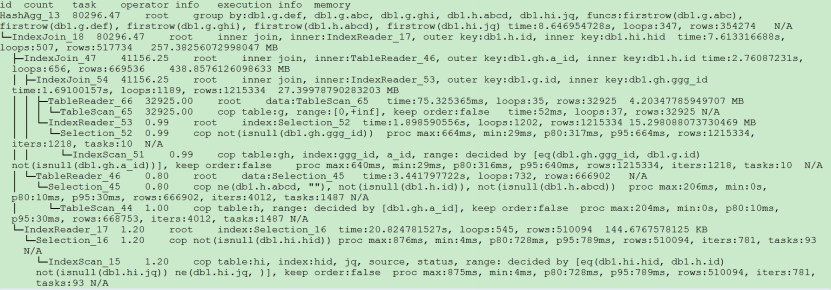
select distinct g.abc, g.def, g.ghi, h.abcd, hi.jq from ggg g left join ggg_host gh on g.id = gh.ggg_id left join host h on gh.a_id = h.id left join a_jq hi on h.id = hi.hid where h.abcd is not null and h.abcd <> '' and hi.jq is not null and hi.jq <> '';
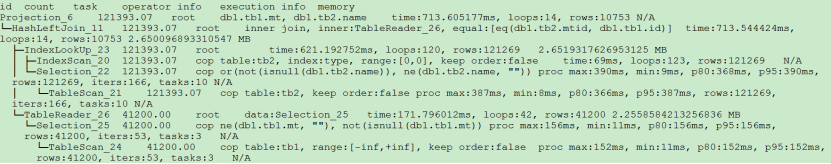
select tb1.mt, tb2.name from tb2 left join tb1 on tb2.mtId=tb1.id where tb2.type=0 and (tb1.mt is not null and tb1.mt != '') and (tb2.name is not null or tb2.name != '');
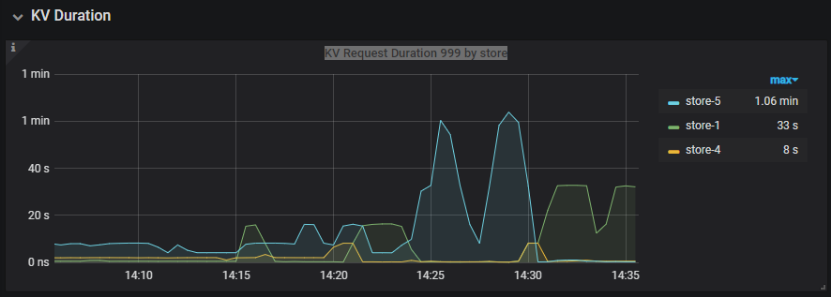
常规日志分析
more tikv.log.2019-10-16-06\:28\:13 |grep slow-query |awk -F ']' '{print $1}' | awk '{print $6}' | sort | uniq -c | sort –n
73 29452
140 33324
757 66625
more tidb-2019-10-14T16-40-51.728.log | grep '"/[1318/]"' |grep 411837294180565013
解决
pd-ctl –u http://x.x.x.x:2379 operator add split-region 66625
[2019/10/16 18:22:56.223 +08:00] [INFO] [operator_controller.go:99] ["operator finish"] [region-id=30796] [operator="\"admin-split-region (kind:admin, region:66625(1668,3), createAt:2019-10-16 18:22:55.888064898 +0800 CST m=+110918.823762963, startAt:2019-10-16 18:22:55.888223469 +0800 CST m=+110918.823921524, currentStep:1, steps:[split region with policy SCAN]) finished\""]
日志显示 region 已经分裂完成,之后查看该 region 相关的 slow-query:
more tikv.log.2019-10-16-06\:28\:13 |grep slow-query | grep 66625
pd-ctl –u http://x.x.x.x:2379 operator add transfer-leader 1 2 //把 region1 的 leader 调度到 store2
案例总结
案例 5:SQL 执行计划不准
背景
分析
SQL 语句
select count(*)
from   tods.bus_jijin_trade_record a, tods.bus_jijin_info b
where   a.fund_code=b.fund_code  and a.type in   ('PURCHASE','APPLY')
and   a.status='CANCEL_SUCCESS' and a.pay_confirm_status = 1
and a.cancel_app_no   is not null and a.id >=    177045000
and a.updated_at   > date_sub(now(), interval 48 hour) ;
mysql> select   count(*)
    -> from tods.bus_jijin_trade_record a,   tods.bus_jijin_info b
    -> where a.fund_code=b.fund_code  and a.type in ('PURCHASE','APPLY')
    -> and a.status='CANCEL_SUCCESS' and   a.pay_confirm_status = 1
    -> and a.cancel_app_no is not null and   a.id >=  177045000
    -> and a.updated_at >   date_sub(now(), interval 48 hour) ;
+----------+
| count(*) |
+----------+
|      708 |
+----------+
1   row in set (1 min 3.77 sec)
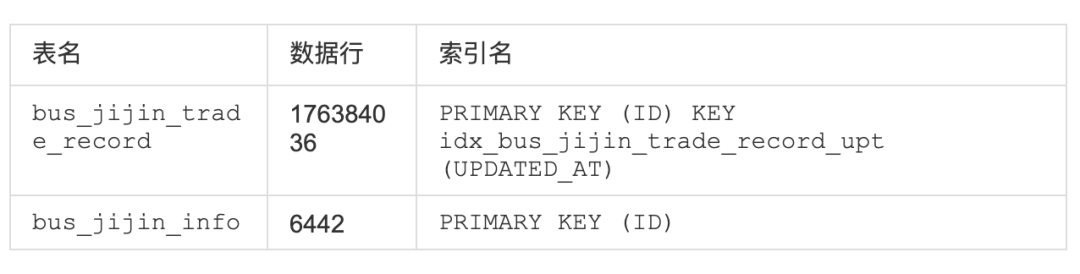
索引信息
查看执行计划
mysql> explain
    -> select count(*)
    -> from tods.bus_jijin_trade_record a,   tods.bus_jijin_info b
    -> where a.fund_code=b.fund_code  and a.type in ('PURCHASE','APPLY')
    -> and a.status='CANCEL_SUCCESS' and   a.pay_confirm_status = 1
    -> and a.cancel_app_no is not null and   a.id >=  177045000
    -> and a.updated_at >   date_sub(now(), interval 48 hour) ;
+----------------------------+--------------+------+-------------------------------------------------------------------------------------------------------------------------------------------------------------------+
| id                         | count        | task | operator info                                                                                                                                                     |
+----------------------------+--------------+------+-------------------------------------------------------------------------------------------------------------------------------------------------------------------+
| StreamAgg_13               | 1.00         | root | funcs:count(1)                                                                                                                                                    |
| └─HashRightJoin_27         | 421.12       | root | inner join, inner:TableReader_18, equal:[eq(a.fund_code, b.fund_code)]                                                                                            |
|   ├─TableReader_18         | 421.12       | root | data:Selection_17                                                                                                                                                 |
|   │ └─Selection_17         | 421.12       | cop  | eq(a.pay_confirm_status, 1), eq(a.status, "CANCEL_SUCCESS"), gt(a.updated_at, 2020-03-03 22:31:08), in(a.type, "PURCHASE", "APPLY"), not(isnull(a.cancel_app_no)) |
|   │   └─TableScan_16       | 145920790.55 | cop  | table:a, range:[177045000,+inf], keep order:false                                                                                                                 |
|   └─TableReader_37         | 6442.00      | root | data:TableScan_36                                                                                                                                                 |
|     └─TableScan_36         | 6442.00      | cop  | table:b, range:[-inf,+inf], keep order:false                                                                                                                      |
+----------------------------+--------------+------+-------------------------------------------------------------------------------------------------------------------------------------------------------------------+
TableScan_16,TableScan_36:表示在 TiKV 端分别对表 a 和 b 的数据进行扫描,其中 TableScan_16 扫描了 1.46 亿的行数;
Selection_17:表示满足表 a 后面 where 条件的数据;
TableReader_37:由于表 b 没有独立的附加条件,所以直接将这部分数据返回给 TiDB;
TableReader_18:将各个 coprocessor 满足 a 表条件的结果返回给 TiDB;
HashRightJoin_27:将 TableReader_37 和 TableReader_18 上的结果进行 hash join;
StreamAgg_13:进一步统计所有行数,将数据返回给客户端;
mysql> SELECT COUNT(*) FROM tods.bus_jijin_trade_record WHERE id >= 177045000 ;
+-----------+
| COUNT(*)  |
+-----------+
| 145917327 |
+-----------+
1 row in set (16.86   sec)
mysql> SELECT COUNT(*) FROM tods.bus_jijin_trade_record WHERE updated_at > date_sub(now(), interval 48 hour)  ;
+-----------+
|  COUNT(*) |
+-----------+
|    713682 |
+-----------+
mysql> select   count(*)
    -> from tods.bus_jijin_trade_record a   use index(idx_bus_jijin_trade_record_upt), tods.bus_jijin_info b
    -> where a.fund_code=b.fund_code  and a.type in ('PURCHASE','APPLY')
    -> and a.status='CANCEL_SUCCESS' and   a.pay_confirm_status = 1
    -> and a.cancel_app_no is not null and   a.id >=  177045000
    -> and a.updated_at >   date_sub(now(), interval 48 hour) ;
+----------+
| count(*) |
+----------+
|      709 |
+----------+
1 row in set (6.27   sec)
mysql> explain
    -> select count(*)
    -> from tods.bus_jijin_trade_record a   use index(idx_bus_jijin_trade_record_upt), tods.bus_jijin_info b
    -> where a.fund_code=b.fund_code  and a.type in ('PURCHASE','APPLY')
    -> and a.status='CANCEL_SUCCESS' and   a.pay_confirm_status = 1
    -> and a.cancel_app_no is not null and   a.id >=  177045000
    -> and a.updated_at >   date_sub(now(), interval 48 hour) ;
+------------------------------+--------------+------+----------------------------------------------------------------------------------------------------------------------------+
| id                           | count        | task | operator info                                                                                                              |
+------------------------------+--------------+------+----------------------------------------------------------------------------------------------------------------------------+
| StreamAgg_13                 | 1.00         | root | funcs:count(1)                                                                                                             |
| └─HashRightJoin_24           | 421.12       | root | inner join, inner:IndexLookUp_20, equal:[eq(a.fund_code, b.fund_code)]                                                     |
|   ├─IndexLookUp_20           | 421.12       | root |                                                                                                                            |
|   │ ├─Selection_18           | 146027634.83 | cop  | ge(a.id, 177045000)                                                                                                        |
|   │ │   └─IndexScan_16       | 176388219.00 | cop  | table:a, index:UPDATED_AT, range:(2020-03-03 23:05:30,+inf], keep order:false                                              |
|   │ └─Selection_19           | 421.12       | cop  | eq(a.pay_confirm_status, 1), eq(a.status, "CANCEL_SUCCESS"), in(a.type, "PURCHASE", "APPLY"), not(isnull(a.cancel_app_no)) |
|   │   └─TableScan_17         | 146027634.83 | cop  |   table:bus_jijin_trade_record, keep order:false                                                                           |
|   └─TableReader_31           | 6442.00      | root | data:TableScan_30                                                                                                          |
|     └─TableScan_30           | 6442.00      | cop  | table:b, range:[-inf,+inf], keep order:false                                                                               |
+------------------------------+--------------+------+----------------------------------------------------------------------------------------------------------------------------+
bus_jijin_trade_record上的统计信息。
mysql> show   stats_meta where table_name like 'bus_jijin_trade_record' and db_name like   'tods';
+---------+------------------------+---------------------+--------------+-----------+
| Db_name | Table_name             | Update_time         | Modify_count | Row_count |
+---------+------------------------+---------------------+--------------+-----------+
| tods    | bus_jijin_trade_record | 2020-03-05 22:04:21 |     10652939 | 176381997 |
+---------+------------------------+---------------------+--------------+-----------+
mysql> show   stats_healthy  where table_name like   'bus_jijin_trade_record' and db_name like 'tods';
+---------+------------------------+---------+
| Db_name | Table_name             | Healthy |
+---------+------------------------+---------+
| tods    | bus_jijin_trade_record |      93 |
+---------+------------------------+---------+
bus_jijin_trade_record有 176381997,修改的行数有 10652939,该表的健康度为:(176381997-10652939)/176381997 *100=93。
解决
mysql> set   tidb_build_stats_concurrency=10;
Query OK, 0 rows   affected (0.00 sec)

#调整收集统计信息的并发度,以便快速对统计信息进行收集
mysql> analyze   table tods.bus_jijin_trade_record;
Query OK, 0 rows   affected (3 min 48.74 sec)
mysql> explain   select count(*)
  -> from tods.bus_jijin_trade_record a,   tods.bus_jijin_info b
  -> where a.fund_code=b.fund_code  and a.type in ('PURCHASE','APPLY')
  -> and a.status='CANCEL_SUCCESS' and   a.pay_confirm_status = 1
  -> and a.cancel_app_no is not null and   a.id >=  177045000
  -> and a.updated_at >   date_sub(now(), interval 48 hour) ;;
+------------------------------+-----------+------+----------------------------------------------------------------------------------------------------------------------------+
| id                           | count     | task | operator info                                                                                                              |
+------------------------------+-----------+------+----------------------------------------------------------------------------------------------------------------------------+
| StreamAgg_13                 | 1.00      | root | funcs:count(1)                                                                                                             |
| └─HashRightJoin_27           | 1.99      | root | inner join, inner:IndexLookUp_23, equal:[eq(a.fund_code, b.fund_code)]                                                     |
|   ├─IndexLookUp_23           | 1.99      | root |                                                                                                                            |
|   │ ├─Selection_21           | 626859.65 | cop  | ge(a.id, 177045000)                                                                                                        |
|   │ │   └─IndexScan_19       | 757743.08 | cop  | table:a, index:UPDATED_AT, range:(2020-03-03 23:28:14,+inf], keep order:false                                              |
|   │ └─Selection_22           | 1.99      | cop  | eq(a.pay_confirm_status, 1), eq(a.status, "CANCEL_SUCCESS"), in(a.type, "PURCHASE", "APPLY"), not(isnull(a.cancel_app_no)) |
|   │   └─TableScan_20         | 626859.65 | cop  | table:bus_jijin_trade_record, keep order:false                                                                             |
|   └─TableReader_37           | 6442.00   | root | data:TableScan_36                                                                                                          |
|     └─TableScan_36           | 6442.00   | cop  | table:b, range:[-inf,+inf], keep order:false                                                                               |
+------------------------------+-----------+------+----------------------------------------------------------------------------------------------------------------------------+
9 rows in set (0.00   sec)
mysql> select   count(*)
    -> from tods.bus_jijin_trade_record a,   tods.bus_jijin_info b
    -> where a.fund_code=b.fund_code  and a.type in ('PURCHASE','APPLY')
    -> and a.status='CANCEL_SUCCESS' and   a.pay_confirm_status = 1
    -> and a.cancel_app_no is not null and   a.id >=  177045000
    -> and a.updated_at >   date_sub(now(), interval 48 hour) ;
+----------+
| count(*) |
+----------+
|      712 |
+----------+
1 row in set (1.69   sec)
案例总结