


点击上方“IT那活儿”公众号,关注后了解更多内容,不管IT什么活儿,干就完了!!!
01
02
HPA原理
总的Pod的利用率是60%+70%+80% = 210%; 当前的Target是3; 算式的结果是70%,大于50%阈值,因此当前的Target 数目过小,需要进行扩容; 重新设置 ,此时算式的结果为42%低于50%,判断还需要扩容两个容器; 此时HPA设置Replicas为5,进行Pod的水平扩容。
03
影响HPA的细节
3.1 噪声处理
3.2 冷却周期
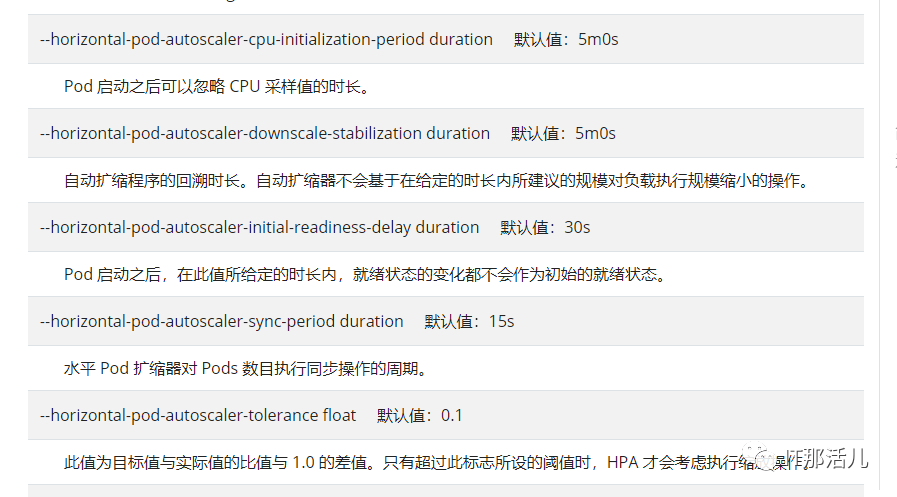
3.3 边界值计算
04
HPA 的API版本
API的v1版本,在当前稳定版本(autoscaling/v1)中只支持基于 CPU 指标的扩缩。 API的beta版本,autoscaling/v2beta1版和autuscaling/v2beta2版引入了基于内存和自定义指标的扩缩,在autoscaling/v2beta1中增加支持custom metrics,在 autoscaling/v2beta2 中增加支持 external metrics。
05
实现流程图
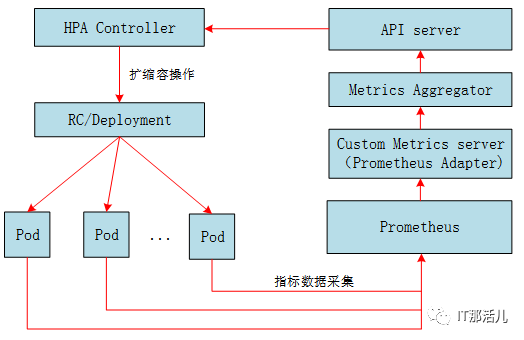
Prometheus:采集Pod的性能指标数据。 Custom Metrics server:从Prometheus中采集性能指标数据。它是资源指标数据的聚合器,实现了自定义指标API(Resource Metres API),通过Kubernetes的Custom Metrics server(Prometheus Adapter)层将自定义指标HPA注册Maste API server中,以/apis/custom.metrics.k8s.io路径提供指标数据。 HAI Controler:为APA控制器,通过自定义指标API从API Server中获取指标数据,以决策扩缩容操作。
06
6.1 安装Custom Metrics server
helm install prometheus-adapter --namespace monitoring ../prometheus-adapter/ -f values.yaml
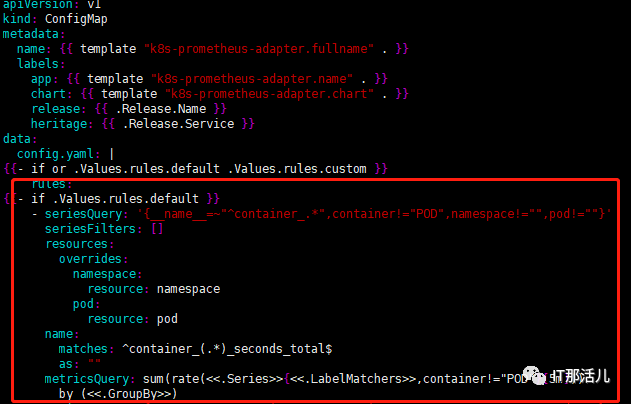
6.2 配置
07
验证
kubectl get --raw "/apis/custom.metrics.k8s.io/v1beta1" | jq .
kubectl get --raw "/apis/custom.metrics.k8s.io/v1beta1/namespaces/monitoring/pods/*/fs_usage_bytes" | jq .
kubectl get --raw "/apis/custom.metrics.k8s.io/v1beta1/namespaces/default/pods/*/http_requests" | jq .

{
"kind": "MetricValueList",
"apiVersion": "custom.metrics.k8s.io/v1beta1",
"metadata": {
"selfLink": "/apis/custom.metrics.k8s.io/v1beta1/namespaces/default/pods/%2A/http_requests"
},
"items": [
{
"describedObject": {
"kind": "Pod",
"namespace": "default",
"name": "podinfo-6c994884cf-m6l6m",
"apiVersion": "/v1"
},
"metricName": "http_requests",
"timestamp": "2020-10-09T03:01:01Z",
"value": "1072m"
},
{
"describedObject": {
"kind": "Pod",
"namespace": "default",
"name": "podinfo-6c994884cf-pns2n",
"apiVersion": "/v1"
},
"metricName": "http_requests",
"timestamp": "2020-10-09T03:01:01Z",
"value": "1035m"
}
]
}
7.1 创建HPA
apiVersion: autoscaling/v2beta2
kind: HorizontalPodAutoscaler
metadata:
name: podinfo-hpa-f
namespace: default
spec:
scaleTargetRef:
apiVersion: apps/v1
kind: Deployment
name: podinfo
minReplicas: 1
maxReplicas: 5
metrics:
- type: Resource
resource:
name: cpu
target:
type: Utilization
averageUtilization: 80
- type: Resource
resource:
name: memory
target:
type: AverageValue
averageValue: 200Mi
- type: Pods
pods:
metric:
name: http_requests
target:
type: AverageValue
averageValue: 50
- type: Object
object:
metric:
name: http_requests
describedObject:
apiVersion: v1
kind: service
name: podinfo
target:
type: Value
value: 50
Resource:基于资源的指标,可以是CPU或者是内存,如果基于这个类型的指标来做只需要部署Metric-server即可,不需要部署自定义APISERVER。 Pods:基于Pod的指标,系统将对Deployment中的全部Pod副本指标进行平均值计算,如果是Pod则该指标必须来源于Pod本身。 Object:基于Ingress或者其他自定义指标,比如ServiceMonitor。它的target类型可以是Value或者AverageValue(根据Pod副本数计算平均值)。
7.2 压测服务并验证HPA
[root@ysgz-33 home]# ./bin/hey -n 10000 –q 2 -c 100 http://10.3.37.189:9898
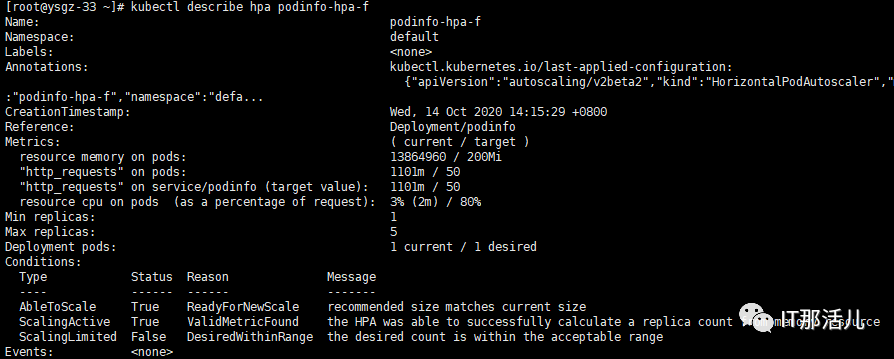
AbleToScale表明HPA是否可以获取和更新扩缩信息,以及是否存在阻止扩缩的各种回退条件。 ScalingActive表明HPA是否被启用(即目标的副本数量不为零)以及是否能够完成扩缩计算。当这一状态为False时,通常表明获取度量指标存在问题。 ScalingLimitted 表明所需扩缩的值被HPA所定义的最大或者最小值所限制。(即已经达到最大或者最小扩缩值)
08
扩展
yum install golang -y
export GOROOT=/usr/lib/golang
export GOPATH=/home
source /etc/profile

cd /home
go get -u github.com/rakyll/hey
go install github.com/rakyll/hey
./bin/hey -n 10000 -q 10 -c 50 http://地址
-n 请求次数
-q 请求速度
-c 请求并发数
09
总结

本文作者:符 海
本文来源:IT那活儿(上海新炬王翦团队)

文章转载自IT那活儿,如果涉嫌侵权,请发送邮件至:contact@modb.pro进行举报,并提供相关证据,一经查实,墨天轮将立刻删除相关内容。
