


通常Prometheus通过Exporter抓取的指标都是白盒指标监控。所谓白盒指标,是直接通过指标就能定位问题的指标。而还需要一种直接能够直接模拟用户访问验证服务的外部可见性的指标获取,称之为黑盒(Blackbox)指标监控。
与白盒测试、黑盒测试的对比类似,黑盒测试只关注结果,不关注其内在实现。而黑盒指标监控,也只关心返回的结果是否是我预期的,不关注其内在如何判断是否达到预期了。
Blackbox Exporter
Prometheus官方提供了一个黑盒监控的Exporter,Blackbox Exporter。Github地址:https://github.com/prometheus/blackbox_exporter。用户可以通过通过HTTP、 HTTPS、 DNS、 TCP 以及 ICMP 的方式对网络进行探测。
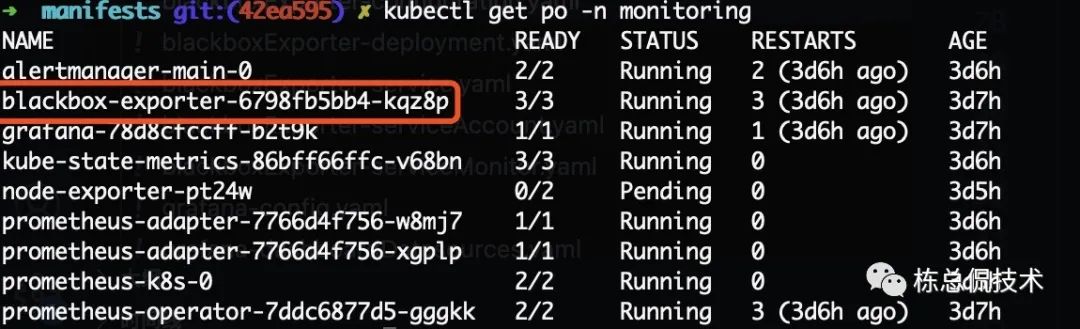
当运行起来Prometheus Operator时,默认的就会以Deployment形式安装好对应的Blackbox Exporter。
而有关Blackbox Exporter运行相关的定义在manifests文件夹下很明显是以blackboxExporter开头的所有文件。
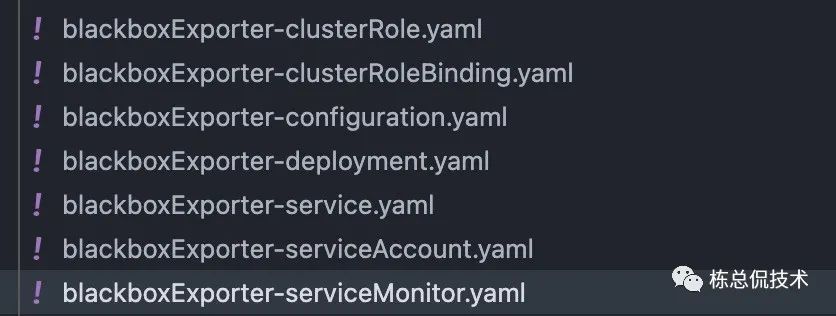
很显然,其中的serviceMonitor相关的配置是为了将Blackbox Exporter对应的Service 集成至Prometheus Server,以便于Prometheus Server能够监控Blackbox Exporter的状态。
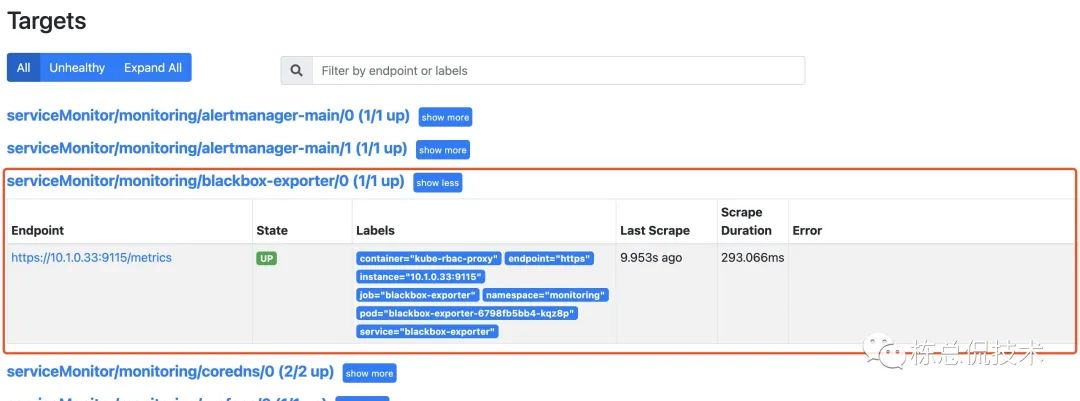
而如何将 Blackbox Exporter所监控的对象也集成至prometheus Server呢?
Blackbox Exporter 配置
我们在如何在Prometheus Operator中配置Blackbox Exporter前,先了解如果是二进制或者容器简单部署的Prometheus是如何集成Blackbox Exporter的。
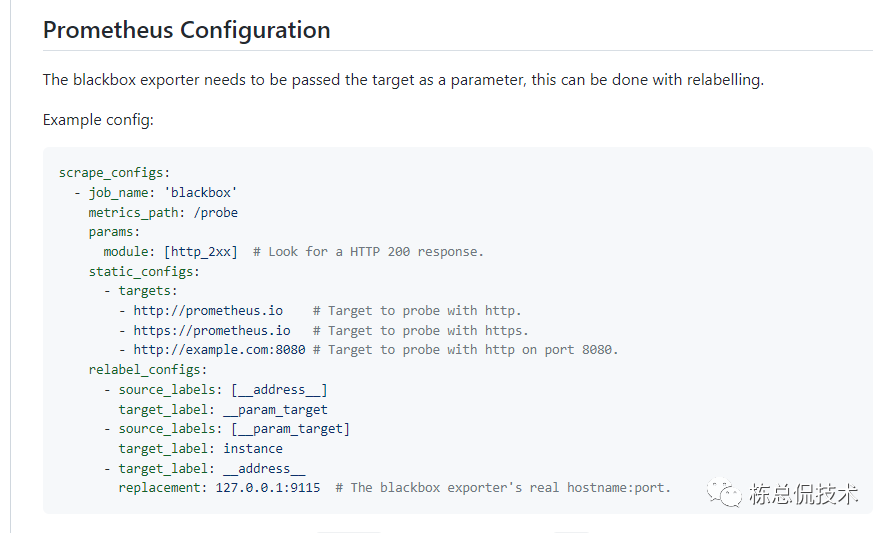
通过在Github上的介绍我们先来了解一些简单的配置:
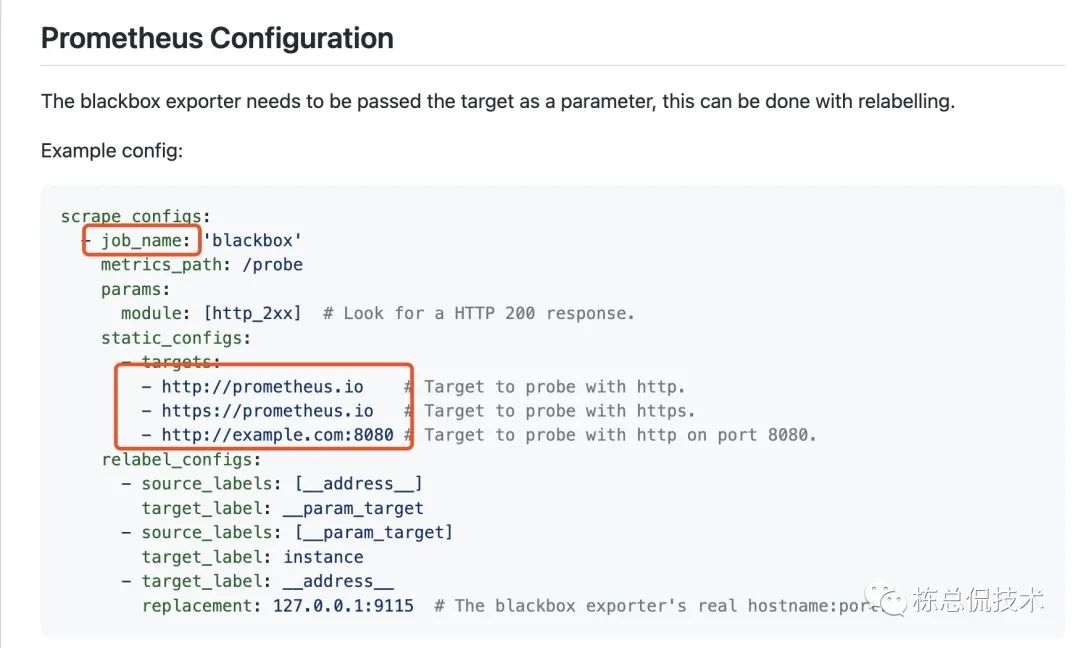
每个黑盒测试的exporter也是抓取配置(scrape_configs)的一个job。
配置的job里面还可以配置多个监控对象。
将一些label替换成指定的监控地址。
指定Blackbox的访问地址。
Probe CRD 的定义
上一步我们知道了通过Prometheus的原生配置,可将Blackbox Exporter集成至Prometheus,而如何配置黑盒监控对象至Prometheus Operator呢?通过上一章节的Prometheus Operator CRD资源的定义,大家应该很快可以联想到其中一个CRD -- Probe CRD。
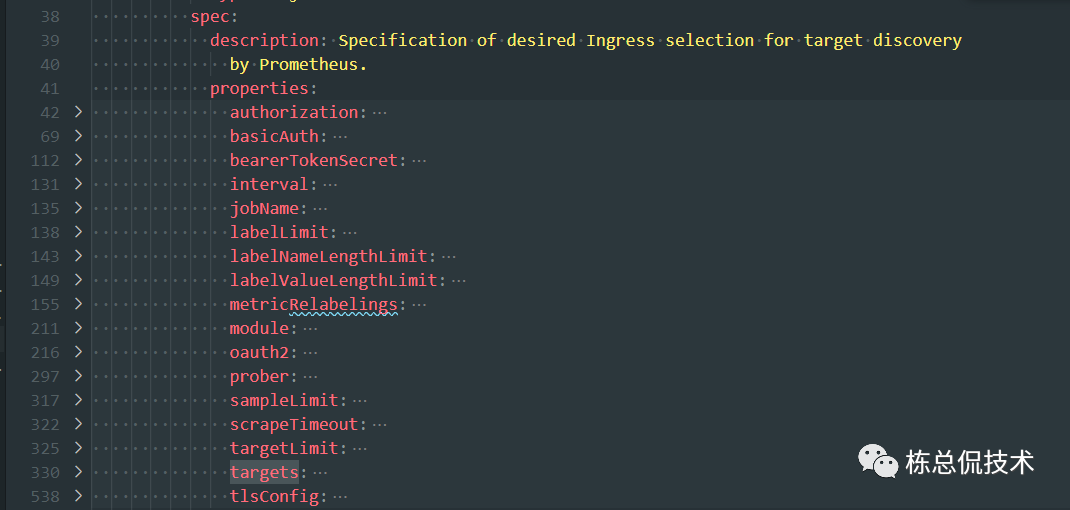
Probe CRD的定义文件在 manifests/setup/0probeCustomResourceDefinition.yaml 目录。
其中 spec.properties与在 https://github.com/prometheus/blackbox_exporter 指导中对Blackbox的参数一致。
我们来定义一个最基础的Probe CRD资源,probe-demo.yaml:
kind: Probe

apiVersion: monitoring.coreos.com/v1

metadata:

  name: example-com-website

  namespace: monitoring

spec:

  interval: 30s

  module: http_2xx

  prober:

    url: blackbox-exporter.monitoring.svc.cluster.local:19115

  targets:

    staticConfig:

      static:

      - http://www.baidu.com

      - http://10.6.209.174:30080/metrics
通过命令 kubectl apply -f probe-demo.yaml,增加该资源的定义后,Prometheus Operator会自动地将该配置集成至prometheus。
通过Prometheus的Configuration查看配置文件:
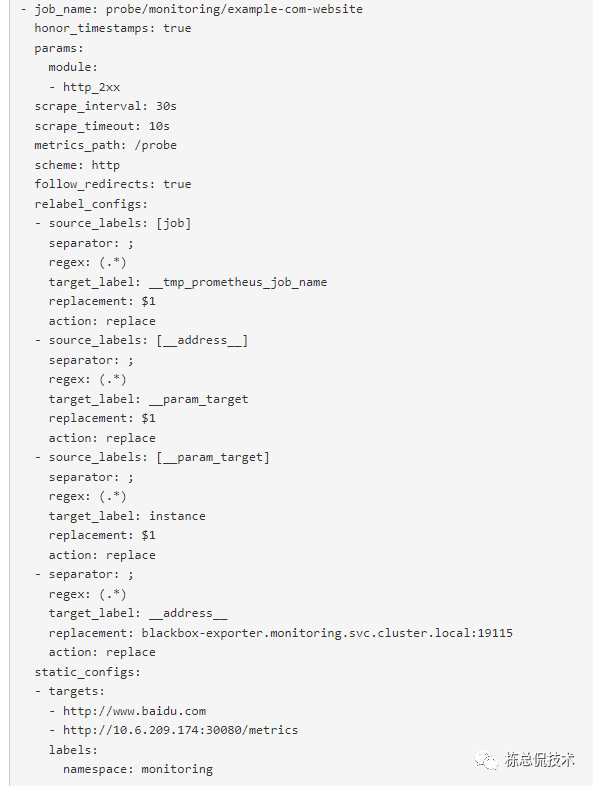
可以确定已经生效,再通过target查看状态:
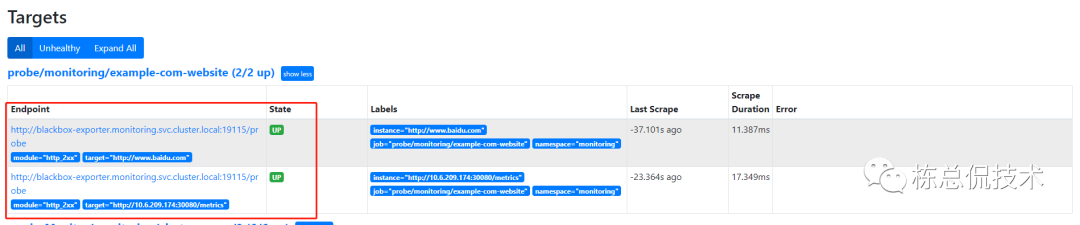
如果增加serviceMonitor CRD资源的定义一样,定义Probe CRD资源一样的也可以将期望的配置集成至Prometheus Server的配置文件,并重新加载生效。
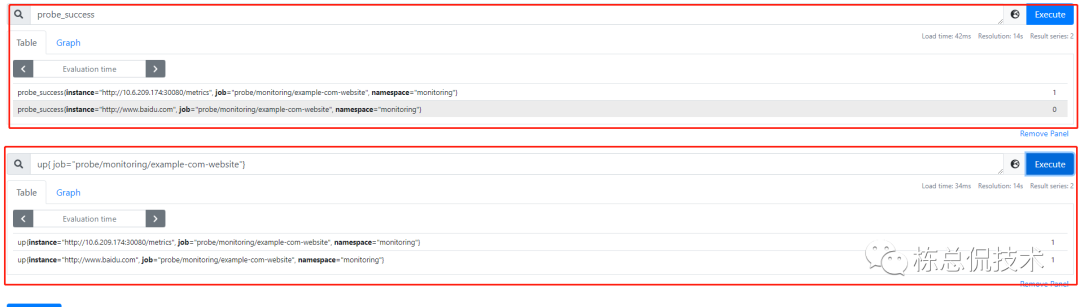
通过查看指标可确定已通过Prometheus获取到对应监控对象的监控指标:
Blackbox Exporter 指标
有关Blackbox更高级的黑盒监控配置可查看其示例的说明,地址:https://github.com/prometheus/blackbox_exporter/blob/master/example.yml。
接下来我们来解读Blackbox获取到的黑盒指标进行说明,大家可根据对大家有用的指标来定义告警规则来及时发现问题。
# HELP probe_dns_lookup_time_seconds Returns the time taken for probe dns lookup in seconds
# TYPE probe_dns_lookup_time_seconds gauge
# DNS解析时间(秒)
probe_dns_lookup_time_seconds 0.0003567
# HELP probe_duration_seconds Returns how long the probe took to complete in seconds
# 整个探针持续时间(秒)
# TYPE probe_duration_seconds gauge
probe_duration_seconds 0.3211242
# HELP probe_failed_due_to_regex Indicates if probe failed due to regex
# TYPE probe_failed_due_to_regex gauge
# 探针是否因正则而失败
# 可根据探针的返回的内容匹配正则表达式,来确定是否成功(进阶用法)
probe_failed_due_to_regex 0
# HELP probe_http_content_length Length of http content response
# TYPE probe_http_content_length gauge
# http响应的长度 header.Content-Lenth
probe_http_content_length -1
# HELP probe_http_duration_seconds Duration of http request by phase, summed over all redirects
# TYPE probe_http_duration_seconds gauge
# TCP建立连接时间
probe_http_duration_seconds{phase="connect"} 0.0618847
# 请求处理时间
probe_http_duration_seconds{phase="processing"} 0.0646315
# 建立连接后第一个响应到达的时间
probe_http_duration_seconds{phase="resolve"} 0.0003567
# 验证证书时间
probe_http_duration_seconds{phase="tls"} 0
# 转移响应的持续时间
probe_http_duration_seconds{phase="transfer"} 0.1937569
# HELP probe_http_redirects The number of redirects
# TYPE probe_http_redirects gauge
# 重定向次数
probe_http_redirects 0
# HELP probe_http_ssl Indicates if SSL was used for the final redirect
# TYPE probe_http_ssl gauge
# ssl最终是否是最终的重定向
probe_http_ssl 0
# HELP probe_http_status_code Response HTTP status code
# TYPE probe_http_status_code gauge
# 返回的状态码
probe_http_status_code 200
# HELP probe_http_uncompressed_body_length Length of uncompressed response body
# body的场地(未压缩)
# TYPE probe_http_uncompressed_body_length gauge
probe_http_uncompressed_body_length 347654
# HELP probe_http_version Returns the version of HTTP of the probe response
# TYPE probe_http_version gauge
# http版本
probe_http_version 1.1
# HELP probe_ip_addr_hash Specifies the hash of IP address. It's useful to detect if the IP address changes.
# TYPE probe_ip_addr_hash gauge
# ip_hash是根据用户请求过来的ip,然后映射成hash值,然后分配到一个特定的服务器里面
# 通过ip_hash是否改变,确定ip是否发生变更
probe_ip_addr_hash 3.780294358e+09
# HELP probe_ip_protocol Specifies whether probe ip protocol is IP4 or IP6
# TYPE probe_ip_protocol gauge
# 使用的ip协议版本号
probe_ip_protocol 4
# HELP probe_success Displays whether or not the probe was a success
# TYPE probe_success gauge
# 探针检测是否成功
probe_success 1
在笔者了解到probe探针前,都是自己写的检测自定义exporter,自定义的exporter仅仅只是判断存活状态,并没有blackbox exporter返回的指标这么完善,回头想来,自己的知识短浅让自己在过去的工作浪费了很多时间
本系列回顾:
Prometheus Operator(二)- 一文理清CRD
Prometheus Operator系列(一)- 一文搞懂ServiceMonitor
