


(本文阅读预计时间:19分钟)
PostgreSQL的监控方案目前使用比较多的有zabbix和prometheus,第三方提供了一些监控模板直接导入即可,也可以根据自己关注点自定义监控指标。但是这些监控安装和配置比较麻烦,本文介绍一款轻量级的监控小工具Sampler,Sampler是用于Shell命令执行,可视化和警报的监控工具。只需要配置一个简单的YAML文件即可。
安装
配置YAML文件
下面是我配置了一个我关注的监控指标,需要的可以直接拷贝下面代码:
variables:PGPASSWORD: xxxxxxpostgres_connection: psql -h localhost -U postgres -p 5432 -d test --no-align--tuples-onlyruncharts:- title: 数据库数据写(Byte)position: [[52, 6], [28, 11]]rate-ms: 1000legend:enabled: truedetails: falsescale: 0items:- label: 后台写color: 178init: $postgres_connectionsample: select bs.block_size * (buffers_checkpoint + buffers_clean + buffers_backend)as total_writen from pg_stat_bgwriter,(SELECT CAST(current_setting('block_size') AS INTEGER) AS block_size) AS bs;- label: 检查点平均写color: 162init: $postgres_connectionsample: select buffers_checkpoint * bs.block_size (checkpoints_timed + checkpoints_req)as checkpoint_write_avg from pg_stat_bgwriter,(SELECT CAST(current_setting('block_size') AS INTEGER) AS block_size) AS bs;- title: 数据库连接position: [[24, 6], [28, 11]]rate-ms: 1000legend:enabled: truedetails: falsescale: 0items:- label: 数据库连接总数init: $postgres_connectionsample: select count(*) from pg_stat_activity;- label: 活跃数据库连接init: $postgres_connectionsample: select count(*) from pg_stat_activity where state = 'active' and pid<> pg_backend_pid();- label: 空闲数据库连接init: $postgres_connectionsample: select count(*) from pg_stat_activity where state = 'idle' and pid<> pg_backend_pid();- label: 空闲未提交数据库连接init: $postgres_connectionsample: select count(*) from pg_stat_activity where state = 'idle in transaction'and pid <> pg_backend_pid();- title: 数据库增删改position: [[0, 6], [24, 11]]rate-ms: 1000legend:enabled: truedetails: falsescale: 0items:- label: 插入行数init: $postgres_connectionsample: select tup_inserted from pg_stat_database where datname = current_database();- label: 删除行数init: $postgres_connectionsample: select tup_deleted from pg_stat_database where datname = current_database();- label: 更新行数init: $postgres_connectionsample: select tup_updated from pg_stat_database where datname = current_database();gauges:- title: 数据库缓存命中率position: [[39, 0], [21, 3]]rate-ms: 1000scale: 2color: 32percent-only: truecur:init: $postgres_connectionsample: select round(sum(blks_hit)*100/sum(blks_hit+blks_read),2)::numericfrom pg_stat_database where datname = current_database();max:sample: echo 100min:sample: echo 0- title: 表缓存命中率position: [[39, 3], [21, 3]]rate-ms: 1000scale: 2color: 160percent-only: truecur:init: $postgres_connectionsample: SELECT SUM(heap_blks_hit)*100 nullif(SUM(heap_blks_hit) + SUM(heap_blks_read),0) FROM pg_statio_user_tables;max:sample: echo 100min:sample: echo 0- title: 索引缓存命中率position: [[60, 3], [20, 3]]rate-ms: 1000scale: 2color: 178percent-only: truecur:init: $postgres_connectionsample: SELECT (SUM(idx_blks_hit))*100 nullif(SUM(idx_blks_hit + idx_blks_read),0) FROM pg_statio_user_indexes;max:sample: echo 100min:sample: echo 0- title: 数据库事务提交率position: [[60, 0], [20, 3]]rate-ms: 1000scale: 2color: 122percent-only: truecur:init: $postgres_connectionsample: select round(100*(xact_commit::numeric/(case when xact_commit > 0then xact_commit else 1 end + xact_rollback)),2)::numeric as commit_ratiofrom pg_stat_database where datname = current_database();max:sample: echo 100min:sample: echo 0textboxes:- title: 服务器状态position: [[0, 0], [39, 6]]rate-ms: 500color: 200sample: top -bn 1 | head -n 5- title: 数据库会话 锁情况position: [[0, 29], [80, 12]]rate-ms: 1000color: 160sample: psql -h localhost -U postgres -p 5432 -d test -c "SELECT COUNT(pg_stat_activity.pid)AS number_of_queries,substring(TRIM(leading FROM regexp_replace(pg_stat_activity.query,'[\n\r]+'::text, ' '::text, 'g'::text)) FROM 0 FOR 80) AS query_name,MAX(age(current_timestamp,query_start)) AS max_wait_time,wait_event,usename,locktype,MODE,granted FROMpg_stat_activity LEFT JOIN pg_locks ON pg_stat_activity.pid = pg_locks.pidWHERE query != '<IDLE>' AND query NOT ilike '%pg_%' AND query NOT ilike '%application_name%'AND query NOT ilike '%inet%' AND age(current_timestamp, query_start) > '5milliseconds'::INTERVAL GROUP BY query_name,wait_event,usename,locktype,MODE,grantedORDER BY max_wait_time DESC;"- title: 数据库实例概况position: [[0, 17], [34, 12]]rate-ms: 1000color: 122init: $postgres_connectionsample: select '数据库版本:' opttype,substring(version(),'(.*) on ') union allselect '数据库当前用户:',current_role union all select '当前访问数据库:',current_database()union all select '当前数据库大小:',pg_size_pretty(pg_database_size(current_database()))union all select '当前数据库表数量:',count(*)::varchar from pg_tables where schemanamenot in('pg_catalog','information_schema') union all select '实例端口:',settingfrom pg_settings where name = 'port' union all select '实例初始化时间:',to_timestamp(((system_identifier>>32)& (2^32 -1)::bigint))::varchar from pg_control_system() union all select '实例启动时间:',pg_postmaster_start_time()::varcharunion all select '实例数据目录:',setting from pg_settings where name = 'data_directory'union all select '实例参数文件:',setting from pg_settings where name = 'config_file'union all select '实例访问配置文件:',setting from pg_settings where name = 'hba_file';- title: 对象膨胀情况position: [[34, 17], [46, 12]]rate-ms: 1000color: 80sample: psql -h localhost -U postgres -p 5432 -d test -c "WITH constants AS (SELECTcurrent_setting('block_size') ::NUMERIC AS bs, 23 AS hdr, 4 AS ma), bloat_infoAS (SELECT ma, bs, schemaname, tablename, (datawidth + (hdr + ma - (CASE WHENhdr%ma = 0 THEN ma ELSE hdr%ma END))) ::NUMERIC AS datahdr, (maxfracsum *(nullhdr + ma - (CASE WHEN nullhdr%ma = 0 THEN ma ELSE nullhdr%ma END))) ASnullhdr2 FROM (SELECT schemaname, tablename, hdr, ma, bs, SUM((1 - null_frac)* avg_width) AS datawidth, MAX(null_frac) AS maxfracsum, hdr + (SELECT 1 +COUNT(*) 8 FROM pg_stats s2 WHERE null_frac <> 0 AND s2.schemaname = s.schemanameAND s2.tablename = s.tablename) AS nullhdr FROM pg_stats s, constants GROUPBY 1,2,3,4,5) AS foo), table_bloat AS (SELECT schemaname, tablename, cc.relpages,bs, ceil((cc.reltuples * ((datahdr + ma - (CASE WHEN datahdr%ma = 0 THEN maELSE datahdr%ma END)) + nullhdr2 + 4)) (bs - 20 ::FLOAT)) AS otta FROM bloat_infoJOIN pg_class cc ON cc.relname = bloat_info.tablename JOIN pg_namespace nnON cc.relnamespace = nn.oid AND nn.nspname = bloat_info.schemaname AND nn.nspname<> 'information_schema'), index_bloat AS (SELECT schemaname, tablename, bs,coalesce(c2.relname, '?') AS iname, coalesce(c2.reltuples, 0) AS ituples,coalesce(c2.relpages, 0) AS ipages, coalesce(ceil((c2.reltuples * (datahdr- 12)) (bs - 20 ::FLOAT)), 0) AS iotta FROM bloat_info JOIN pg_class ccON cc.relname = bloat_info.tablename JOIN pg_namespace nn ON cc.relnamespace= nn.oid AND nn.nspname = bloat_info.schemaname AND nn.nspname <> 'information_schema'JOIN pg_index i ON indrelid = cc.oid JOIN pg_class c2 ON c2.oid = i.indexrelid)SELECT TYPE 对象类型, schemaname||'.'||object_name 对象名, bloat 膨胀率, pg_size_pretty(raw_waste)AS 膨胀量 FROM (SELECT 'table' AS TYPE, schemaname, tablename AS object_name,round(CASE WHEN otta = 0 THEN 0.0 ELSE table_bloat.relpages / otta ::NUMERICEND, 1) AS bloat, CASE WHEN relpages < otta THEN '0' ELSE (bs * (table_bloat.relpages- otta) ::bigint) ::bigint END AS raw_waste FROM table_bloat UNION SELECT'index' AS TYPE, schemaname, tablename || '::' || iname AS object_name, round(CASEWHEN iotta = 0 OR ipages = 0 THEN 0.0 ELSE ipages / iotta ::NUMERIC END, 1)AS bloat, CASE WHEN ipages < iotta THEN '0' ELSE (bs * (ipages - iotta)) ::bigintEND AS raw_waste FROM index_bloat) bloat_summary ORDER BY raw_waste DESC,bloat DESC LIMIT 10;"
运行
sampler -c config.yml
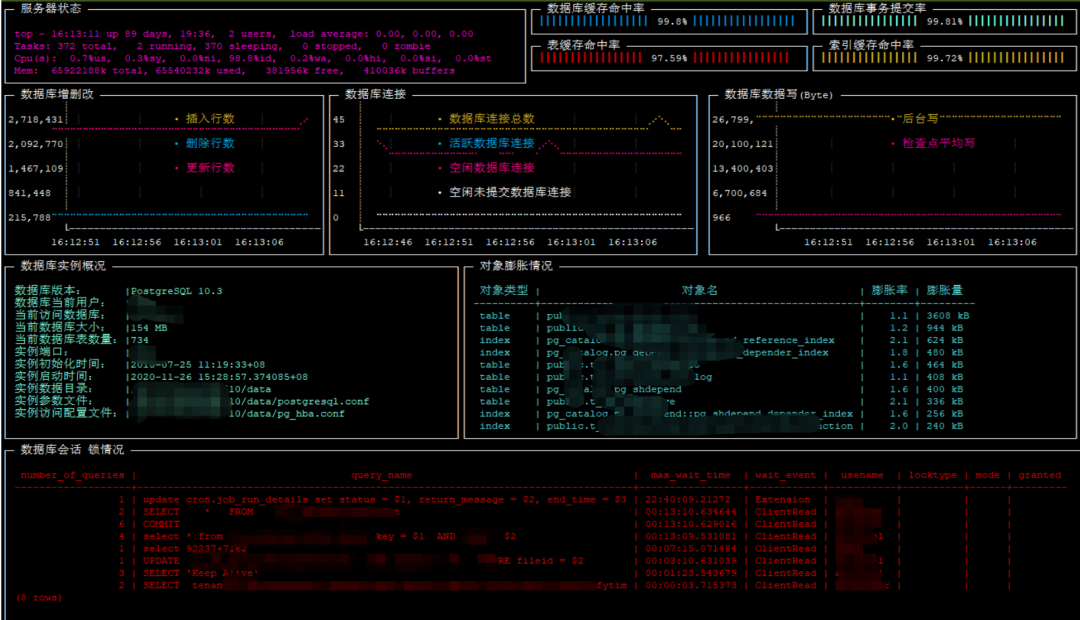
监控效果


PostgreSQL与Oracle:成本、易用性和功能上的差异


文章转载自公众号:晟数学院
作者:jerry-89
文章转载自开源软件联盟PostgreSQL分会,如果涉嫌侵权,请发送邮件至:contact@modb.pro进行举报,并提供相关证据,一经查实,墨天轮将立刻删除相关内容。
