


Maria Colgan
资深产品经理,发表于2011-1-28。
收集优化器统计信息是生活中必须面对的一个坏处,甚至它可能花费特别长的时间才能完成。在这篇博客中,我们将讨论一种改进统计信息收集效率的方法。
引言
Oracle Database 11g Release 2 (11.2.0.2)开始引入了一个新的统计信息收集方式–并发统计信息收集。该方式的目标是允许用户并发收集位于SCHEMA(或数据库)中的多个表,和一个表中的多个分区(或子分区)。在多个表或表中的分区上并发收集统计信息,可以允许Oracle充分利用多处理器环境,减少进行统计信息收集所花费的整体时间。
并发统计信息收集由DBMS_STATS包中的全局参数CONCURRENT控制。该参数为布尔类型,因此,它可以被设置为TRUE或FALSE值。默认情况下,其值为FALSE。当CONCURRENT设置为TRUE时,Oracle使用Oracle作业调度器和高级队列组件来同时创建和管理多个收集统计信息的作业。
如果你对一个分区表调用 dbms_stats.gather_table_stats,并设置CONCURRENT值为TRUE时,Oracle会为表中的每一个分区(或子分区)创建单独的统计信息收集作业。作业调度器将决定这些作业中有多少将并发执行,以及有多少将基于可用的系统资源排队。当当前执行的作业完成后,更多的作业将出队并执行,直至全部的分区(或子分区)都收集了他们的统计信息。
如果你收集统计信息时,使用的是dbms_stats.gather_database_stats, dbms_stats.gather_schema_stats, 或者 dbms_stats.gather_dictionary_stats, 那么Oracle将为每一个非分区表和分区表中的每一个分区(或子分区)创建一个单独的统计信息收集作业。每一个分区表还会有一个协调作业,来管理它自己的分区(或子分区)作业。数据库会运行尽可能多的并发作业,并排队其余的作业,直至作业全部完成。但是,不允许同时对多个分区表进行处理,以防止可能的死锁情况发生。因此,如果存在对某个分区表的运行中的作业,其它分区表将排队等待,直到当前的这个作业完成。对于非分区表没有这样的限制,并发统计信息收集作业的最大数量,受作业队列进程初始化参数JOB_QUEUE_PROCESSES(RAC环境中的每个节点)和可用系统资源的限制。
下图说明了在不同级别创建作业,其中表3是分区表,而其他表是非分区表。作业3充当表3的协调器作业,并为该表中的每个分区创建一个作业,以及为表3的全局统计信息创建一个单独的作业。
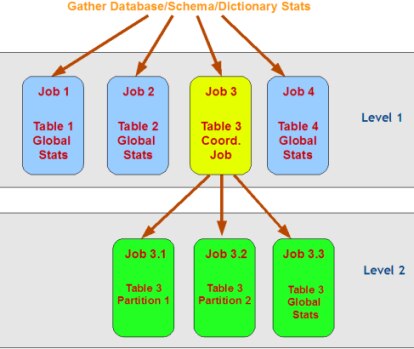
图1:在Oracle 11g R2中,统计信息收集期间的作业调度
另一个例子,假设参数job_queue_processes设置为32,并且你在SH模式下发出了dbms_stats.gather_schema_stats命令,Oracle会为下面的每一个非分区表创建一个统计信息收集作业(如图1中所示的LEVEL 1):
SUPPLEMENTARY_DEMOGRAPHICS
COUNTRIES
CUSTOMERS
PROMOTIONS
CHANNELS
PRODUCTS
TIMES
并且,为每一个分区表各创建一个协调作业,例如,SALSE和COSTS表。对应于图1中的LEVEL 2。然后,Oracle的作业调度器会允许32个统计信息收集作业启动,而剩余的作业排队(假设有足够的资源支持32个并发作业)。假设为SALES分区表启动了29个作业(每个分区1个+1个协调作业),那么还可以允许启动3个针对非分区表的统计信息收集作业。而分区表COSTS上的统计信息收集作业将自动排队,因为同一时刻,只允许处理对一个分区表的作业。每完成一个作业,就会有队列中的一个作业出队并启动,直到全部63个作业完成。
配置和设置
在Oracle Database 11.2.0.2中,针对统计信息的并发设置默认是关闭的。可以使用如下命令打开:
Begin

DBMS_STATS.SET_GLOBAL_PREFS('CONCURRENT','TRUE');

End;

/
除了收集统计数据所需的常规权限之外,您还需要一些额外的权限。用户必须具有以下作业计划程序和AQ权限:
CREATE JOB
MANAGE SCHEDULER
MANAGE ANY QUEUE
SYSAUX表空间应处于ONLINE状态,因为作业调度器存储它的内部表和视图在SYSAUX表空间中。
最后,job_queue_processes参数至少要设置为4.如果你希望在处理统计信息收集时,充分利用所有的系统资源,但有不想使用并行执行,你应当设置job_queue_processes为2*CPU核数(在RAC环境下,每个节点都要设置)。您需要确保在系统级别进行设置(比如使用ALTER SYSTEM … 或在init.ora文件中设置),而不是在会话级别设置(比如,使用alter session)。
使用带有并行执行的并发统计信息收集
使用并发统计信息收集时,仍然可以并行执行每个单独的统计信息收集作业。 这种组合通常发生在要收集的对象很大时。如果你计划用并行的方式来并发的执行统计信息收集作业,你应该关闭初始化参数parallel adaptive multi-user,即:
Alter system set parallel_adaptive_multi_user=false;
还建议您启用并行语句队列。这要求激活资源管理器(如果尚未激活),并创建临时资源计划,其中消费者组“OTHER_GROUPS”应启用队列。默认情况下,资源管理器仅在维护窗口期间激活。下面的脚本演示了一种创建临时资源计划(pqq_test),并使用此计划启用资源管理器的方法。
-- connect as a user with dba privileges

begin

  dbms_resource_manager.create_pending_area();

  dbms_resource_manager.create_plan('pqq_test', 'pqq_test');

  dbms_resource_manager.create_plan_directive(

        'pqq_test',

        'OTHER_GROUPS',

        'OTHER_GROUPS directive for pqq',

        parallel_target_percentage =>
90);

  dbms_resource_manager.submit_pending_area();

end;

/

ALTER SYSTEM SET RESOURCE_MANAGER_PLAN = 'pqq_test' SID='*';
监控并发统计信息收集作业
你可以使用标准的数据库作业视图来监控并发统计信息收集作业。DBA_SCHEDULER_JOBS表的COMMENTS字段以owner.table.(sub)partition的格式,显示了统计信息收集作业的目标对象。所有统计信息收集作业的名称为便于区分,以‘ST’开始。而名称以‘STT######’开始的作业,均是分区表的协调作业创建的。服务于分区表上的分区或子分区。而名称以‘STSD###_###’开始的作业,均是为SCHEMA或数据库中的表创建的。要么作为一个协调作业服务于分区级的作业(如果表是分区表),要么直接对表(非分区表)收集统计信息。最后,那些带有‘STD######’字样的是为数据字典级(当执行 gather_dictionary_stats时)的作业而创建的,并且与‘ST$SD###_###’开始的作业做类似的工作。
使用如下查询,你可以看到所有已创建的并行统计信息收集作业:
select job_name, state, comments

from dba_scheduler_jobs

where job_class like 'CONC%'
为了只看当前正在运行的作业,通过作业状态(STATE)列过滤:
select job_name, state, comments

from dba_scheduler_jobs

where job_class like 'CONC%'

and state = 'RUNNING';
类似的,查看计划中的作业(例如,待运行的),你只需要改变STATE条件值:
select job_name, state, comments

from dba_scheduler_jobs

where job_class like 'CONC%'

and state = 'SCHEDULED';
还有可能看到当前运行的统计信息收集作业已历经的时长:
select job_name, elapsed_time

from dba_scheduler_running_jobs

where job_name like 'ST$%';
已知的限制
并发统计信息收集可以运行的最大并发运行作业数,不使用任何自动方法,通过基于系统负载和资源来确定。并发统计信息收集仅依赖于作业调度器和作业队列进程参数JOB_QUEUE_PROCESSES的值。
会话范围的参数设置和事件不会传输到新创建的作业(受限于调度程序)。
索引不能被并行收集。
原文链接:https://blogs.oracle.com/optimizer/concurrent-statistics-gathering
原文内容:
January 28, 2011
Concurrent Statistics Gathering
Maria Colgan
DISTINGUISHED PRODUCT MANAGER
Gathering optimizer statistics is one of life’s necessary evils even if it can take an extremely long time to complete. In this blog post, we discuss one remedy to improve the efficiency of statistics gathering.
Introduction
Oracle Database 11g Release 2 (11.2.0.2) introduces a new statistics gathering mode, ‘concurrent statistics gathering’. The goal of this new mode is to enable a user to gather statistics on multiple tables in a schema (or database), and multiple (sub)partitions within a table concurrently. Gathering statistics on multiple tables and (sub)partitions concurrently can reduce the overall time it takes to gather statistics by allowing Oracle to fully utilize a multi-processor environment.
Concurrent statistics gathering is controlled by a global preference, CONCURRENT, in the DBMS_STATS package. The CONCURRENT preference is of type boolean, so it can be set to TRUE or FALSE. By default it is set to FALSE. When CONCURRENT is set to TRUE, Oracle employs Oracle Job Scheduler and Advanced Queuing components to create and manage multiple statistics gathering jobs concurrently.
If you call dbms_stats.gather_table_stats on a partitioned table when CONCURRENT is set to true, Oracle will create a separate statistics gathering job for each (sub)partition in the table. The Job Scheduler will decide how many of these jobs will execute concurrently, and how many will be queued based on available system resources. As the currently running jobs complete, more jobs will be dequeued and executed until all (sub)partitions have had their statistics gathered on them.
If you gather statistics using dbms_stats.gather_database_stats, dbms_stats.gather_schema_stats, or dbms_stats.gather_dictionary_stats, then Oracle will create a separate statistics gathering job for each non-partitioned table, and each (sub)partition for the partitioned tables. Each partitioned table will also have a coordinator job that manages its (sub)partition jobs. The database will then run as many concurrent jobs as possible, and queue the remaining jobs until the executing jobs complete. However, multiple partitioned tables are not allowed to be processed simultaneously to prevent possible deadlock cases. Hence, if there are some jobs running for a partitioned table, other partitioned tables in a schema (or database or dictionary) will be queued until the current one completes. There is no such restriction for non-partitioned tables. The maximum number of concurrent statistics gathering jobs is bounded by the job_queue_processes initialization parameter (per node on a RAC environment) and the available system resources.
The following figure illustrates the creation of jobs at different levels, where Table 3 is a partitioned table, while other tables are non-partitioned tables. Job 3 acts as a coordinator job for Table 3, and creates a job for each partition in that table, as well as a separate job for the global statistics of Table 3.
Job Creation.small3.png
Figure
1: Job Scheduling during Optimizer
Statistics Gathering in Oracle 11g R2
As another example, assume that the parameter job_queue_processes is set to 32, and you issued a dbms_stats.gather_schema_stats on the SH schema. Oracle would create a statistics gathering job (Level 1 in Figure 1) for each of the non-partitioned tables;
SUPPLEMENTARY_DEMOGRAPHICS
COUNTRIES
CUSTOMERS
PROMOTIONS
CHANNELS
PRODUCTS
TIMES
And, a coordinator job for each partitioned table, i.e., SALES and COSTS, in turn creates a statistics gathering job for each of partition in SALES and COSTS tables, respectively (Level 2 in Figure 1). Then, the Oracle Job Scheduler would allow 32 statistics gathering jobs to start, and would queue the rest (assuming that there are sufficient resources for 32 concurrent jobs). Suppose that 29 jobs (one for each partition + a coordinator job) for the SALES table get started, then three non-partitioned table statistics gathering jobs would also be started. The statistics gathering jobs for the COSTS table will be automatically queued, because only for one partitioned table can be processed at any one time. As each job finishes, another job will be dequeued and started, until all 63 jobs have been completed.
Configuration and Settings
In Oracle Database 11.2.0.2, the concurrency setting for statistics gathering is turned off by default. It can be turned on using the following command.
Begin
DBMS_STATS.SET_GLOBAL_PREFS(‘CONCURRENT’,‘TRUE’);
End;
/
You will also need some additional privileges above and beyond the regular privileges required to gather statistics. The user must have the following Job Scheduler and AQ privileges:
CREATE JOB
MANAGE SCHEDULER
MANAGE ANY QUEUE
The SYSAUX tablespace should be online, as the Job Scheduler stores its internal tables and views in SYSAUX tablespace.
Finally the job_queue_processes parameter should be set to at least 4. If you want to fully utilize all of the system resources during the statistics gathering process but you don’t plan to use parallel execution you should set the job_queue_processes to 2* total number of CPU cores (this is a per node parameter in a RAC environment).Please make sure that you set this parameter system-wise (i.e., ALTER SYSTEM … or in init.ora file) rather than at the session level (i.e., ALTER SESSION).
Using Concurrent Statistics Gathering with Parallel Execution
When using concurrent statistics gathering it is still possible to have each individual statistics gather job execute in parallel. This combination is normally used when the objects (tables or (sub)partitions) being analyzed are large. If you plan to execute the concurrent statistics gathering jobs in parallel you should disable the parallel adaptive multi-user initialization parameter. That is;
Alter system set parallel_adaptive_multi_user=false;
It is also recommended that you enable parallel statement queuing. This requires Resource Manager to be activated (if not already), and the creation of a temporary resource plan where the consumer group “OTHER_GROUPS” should have queuing enabled. By default, Resource Manager is activated only during the maintenance windows. The following script illustrates one way of creating a temporary resource plan (pqq_test), and enabling the Resource Manager with this plan.
– connect as a user with dba privileges
begin
dbms_resource_manager.create_pending_area();
dbms_resource_manager.create_plan(‘pqq_test’, ‘pqq_test’);
dbms_resource_manager.create_plan_directive(
    'pqq_test',

    'OTHER_GROUPS',

    'OTHER_GROUPS directive for pqq',

    parallel_target_percentage =>
90);
dbms_resource_manager.submit_pending_area();
end;
/
ALTER SYSTEM SET RESOURCE_MANAGER_PLAN = ‘pqq_test’ SID=’*’;
Monitoring Concurrent Statistics Gathering Jobs
You can use the standard database scheduler views to monitor the concurrent statistics gathering jobs. The comments field of a job in dba_scheduler_jobs shows the target object for that statistics gathering job in the form of owner.table.(sub)partition. All statistics collection job names start with 'STT###_### are created by a coordinator job for a partitioned table, and works on a partition or subpartition of the table.
The jobs whose name begin with ST$SD###_### are created for a table in a schema or database, and either works as a coordinator for its partition level jobs (if the table is partitioned), or directly performs the statistics collection for the table (if the table is not partitioned).
Finally, those with ST$D###_### in their naming are created for dictionary level tasks (when gather_dictionary_stats is used), and jobs does similar tasks as those with SD in their names.
Using the following query you can see all of the concurrent statistics gathering jobs that have been created:
select job_name, state, comments
from dba_scheduler_jobs
where job_class like ‘CONC%’
To only see the currently running jobs, filter
by the job state:
select job_name, state, comments
from dba_scheduler_jobs
where job_class like ‘CONC%’
and state = ‘RUNNING’;
Similarly, to see the scheduled (i.e., waiting to run) jobs you just need to change the state:
select job_name, state, comments
from dba_scheduler_jobs
where job_class like ‘CONC%’
and state = ‘SCHEDULED’;
It is also possible to see the elapse time for the currently running statistics gathering jobs:
select job_name, elapsed_time
from dba_scheduler_running_jobs
where job_name like ‘ST$%’;
Known Limitations
Concurrent statistics gathering does not use any automated way to determine the maximum number of jobs that can concurrently run based on the system load and resources. Concurrent statistics gathering solely relies on the Job Scheduler and the value of the job_queue_processes parameter.
Session-wide parameter settings and events are not transferred to the newly created jobs (scheduler limitation).
Indexes are not gathered concurrently.
