


当然,任何数据库中的等待事件时间都将包括一些 CPU 时间,尽管理想情况下它应该是最少的。等待应该尽可能接近关闭 CPU 等待事件,即如果我正在执行 IO,那么我希望等待仅涵盖读取调用:
start_wait('my_read_wait');
pread( ... );
end_wait('my_read_wait');
因此,我设置读取的函数将执行一些 CPU,这些 CPU 可能会在等待本身的掩护下被捕获,并且对 pread 的调用将使用一些 CPU,但大多数时间应该等待实际的 I/O,如果 I/O 来自存储。
start_wait('my_lock');
semtimedop(...);
end_wait('my_lock');
在 MySQL 上,我注意到 CPU 上的平均活动会话通常远低于主机报告的 CPU 利用率。例如,如果我在 2 个 vCPU 主机上 100% 的时间在 CPU 上有一个连接,那么 CPU 利用率应该在 50% 左右。其他进程可能还有其他一些 CPU 活动,但如果数据库是主机上唯一的东西并且我只有一个活动连接,那么这是一个非常好的近似值。CPU 上的一个连接 100% 的时间与 CPU 上的 1 个平均活动会话 (AAS) 或 CPU 上的 1 个 AAS 相同。
在 MySQL 系统上,我经常看到 CPU 上的 AAS 平均为 10%,而主机的 CPU 利用率为 50% 甚至 100%。
最后我今天运行了一个测试,我在一个 2 个 vCPU 主机上运行了 2 个会话,使用同一个表3次运行连接,没有索引,也没有谓词过滤器。这基本上使 SQL 必须执行 N * N * N 查找,其中 N 是表中的行数。在这种情况下,该表适合读入内存,因此这应该是纯 CPU 操作,是的,主机操作系统报告了 100% CPU。但在我的情况下,它在 CPU 上出现了零 AAS,在等待“wait/io/table/sql/handler”上出现了 2 个 AAS。
在 MySQL 上,我经常在顶部等待中看到“wait/io/table/sql/handler”,并且当 SQL 运行应该只是读取内存中的缓冲区时发生。这是一个例子:
CREATE TABLE seed ( id INT AUTO_INCREMENT PRIMARY KEY, val INT);
 insert into seed(val) values (1);
 insert into seed(val) select val from seed; /* 2 */
 insert into seed(val) select val from seed; /* 4 */
 insert into seed(val) select val from seed; /* 8 */
 insert into seed(val) select val from seed; /* 16 */
 insert into seed(val) select val from seed; /* 32 */
 insert into seed(val) select val from seed; /* 64 */
 insert into seed(val) select val from seed; /* 128 */
 insert into seed(val) select val from seed; /* 256 */
 insert into seed(val) select val from seed; /* 512 */
 insert into seed(val) select val from seed; /* 1024 */
 insert into seed(val) select val from seed; /* 2048 */
 insert into seed(val) select val from seed; /* 4096 */
 insert into seed(val) select val from seed; /* 8192 */
 insert into seed(val) select val from seed; /* 16384 */
create table seed1 as select * from seed;
create table seed2 as select * from seed;
然后通过几个会话运行以下查询。
select count(*) from seed a, seed1 b, seed2 c where a.id=b.id and a.id=c.id;
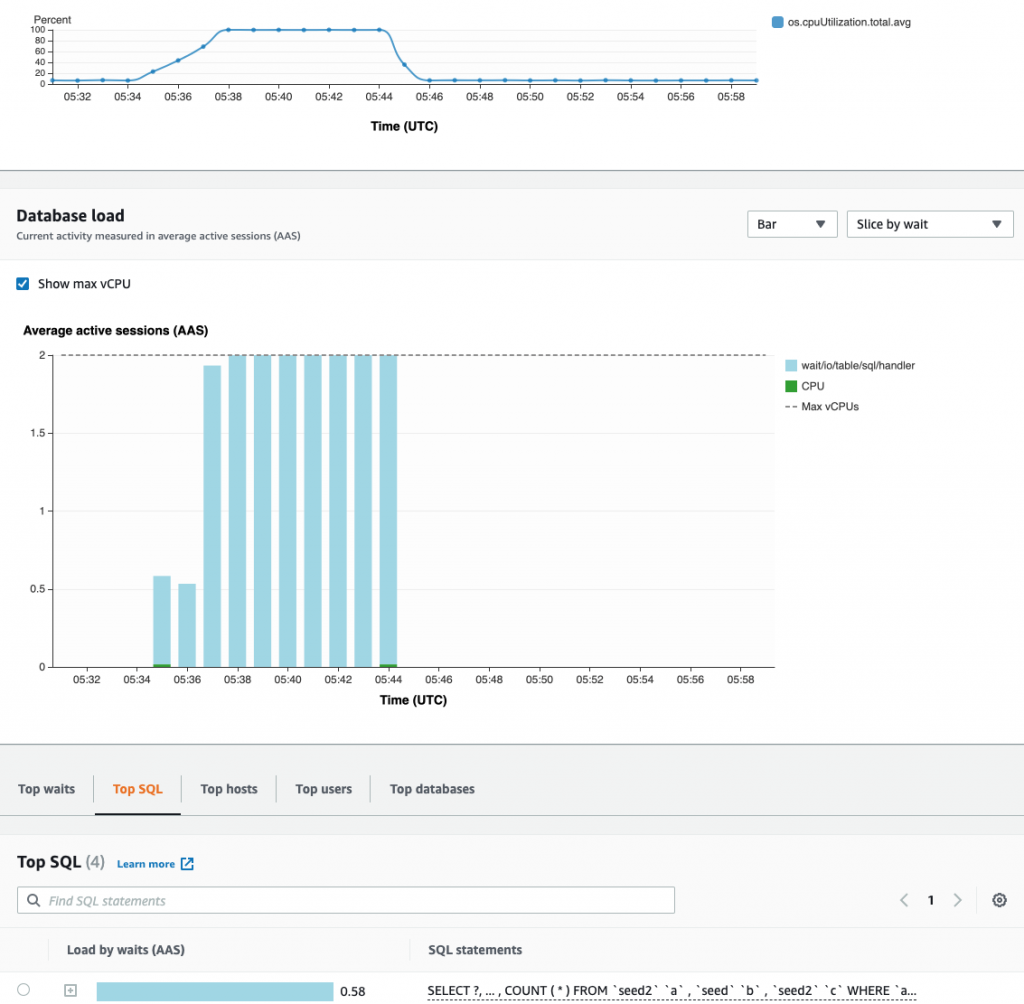
这是 Amazon RDS 中的 Performance Insights 控制面板。CPU 利用率从大约 5% 变为 100%,DB 负载从 0 变为 2,几乎所有负载都在“wait/io/table/sql/handler”上
现在,如果我们追踪 IO 等待。我们可以看到它被包裹在 fetch 行上,而没有真正看到 fetch 是在执行 I/O 还是从缓存中读取:
https://github.com/mysql/mysql-server/blob/5.7/sql/handler.cc#L3047
 MYSQL_TABLE_IO_WAIT(PSI_TABLE_FETCH_ROW, active_index, result,
 { result= index_read_map(buf, key, keypart_map, find_flag); })
 if (!result && m_update_generated_read_fields)
 {
 result= update_generated_read_fields(buf, table, active_index);
 m_update_generated_read_fields= false;
 }
 DBUG_RETURN(result);
}
index_read_map: https://github.com/mysql/mysql-server/blob/5.7/sql/handler.h#L2819
virtual int index_read_map(uchar * buf, const uchar * key,
                             key_part_map keypart_map,
                             enum ha_rkey_function find_flag)
  {
    uint key_len= calculate_key_len(table, active_index, keypart_map);
    return  index_read(buf, key, key_len, find_flag);
  }
calculate_key_len: https://github.com/mysql/mysql-server/blob/5.7/sql/handler.cc#L3047
uint calculate_key_len(TABLE *table, uint key,
                       key_part_map keypart_map)
{
  /* works only with key prefixes */
  assert(((keypart_map + 1) & keypart_map) == 0);

  KEY *key_info= table->key_info + key;
  KEY_PART_INFO *key_part= key_info->key_part;
  KEY_PART_INFO *end_key_part= key_part + actual_key_parts(key_info);
  uint length= 0;

  while (key_part < end_key_part && keypart_map)   {     length+= key_part->store_length;
    keypart_map >>= 1;
    key_part++;
  }
  return length;
}
IO 等待也被检测为
IO waits

MYSQL_TABLE_IO_WAIT(PSI_TABLE_FETCH_ROW, MAX_KEY, result, { result= rnd_pos(buf, pos); })
MYSQL_TABLE_IO_WAIT(PSI_TABLE_FETCH_ROW, active_index, result, { result= index_read_map(buf, key, keypart_map, find_flag); })
MYSQL_TABLE_IO_WAIT(PSI_TABLE_FETCH_ROW, index, result, { result= index_read_idx_map(buf, index, key, keypart_map, find_flag); })
MYSQL_TABLE_IO_WAIT(PSI_TABLE_FETCH_ROW, active_index, result, { result= index_next(buf); })
MYSQL_TABLE_IO_WAIT(PSI_TABLE_FETCH_ROW, active_index, result, { result= index_prev(buf); })
MYSQL_TABLE_IO_WAIT(PSI_TABLE_FETCH_ROW, active_index, result, { result= index_first(buf); })
MYSQL_TABLE_IO_WAIT(PSI_TABLE_FETCH_ROW, active_index, result, { result= index_last(buf); })
MYSQL_TABLE_IO_WAIT(PSI_TABLE_FETCH_ROW, active_index, result, { result= index_next_same(buf, key, keylen); })
MYSQL_TABLE_IO_WAIT(PSI_TABLE_WRITE_ROW, MAX_KEY, error, { error= write_row(buf); })
MYSQL_TABLE_IO_WAIT(PSI_TABLE_UPDATE_ROW, active_index, error, { error= update_row(old_data, new_data);})
MYSQL_TABLE_IO_WAIT(PSI_TABLE_DELETE_ROW, active_index, error, { error= delete_row(buf);})
MYSQL_TABLE_IO_WAIT
https://github.com/mysql/mysql-server/blob/8d8c986e5716e38cb776b627a8eee9e92241b4ce/sql/handler.cc

#define MYSQL_TABLE_IO_WAIT(OP, INDEX, RESULT, PAYLOAD)
...
case PSI_BATCH_MODE_STARTING: {
m_psi_locker = PSI_TABLE_CALL(start_table_io_wait)
PSI_TABLE_CALL
include/mysql/psi/mysql_table.h

#define PSI_TABLE_CALL(M) psi_table_service->M
psi_table_service
https://github.com/mysql/mysql-server/blob/8d8c986e5716e38cb776b627a8eee9e92241b4ce/mysys/psi_noop.cc#L536

static struct PSI_table_locker *start_table_lock_wait_noop(
struct PSI_table_locker_state *, struct PSI_table *,
enum PSI_table_lock_operation, ulong, const char *, uint) {
return nullptr;
}

...
static PSI_table_service_t psi_table_noop = {
get_table_share_noop, release_table_share_noop,
drop_table_share_noop, open_table_noop,
unbind_table_noop, rebind_table_noop,
close_table_noop, start_table_io_wait_noop,
end_table_io_wait_noop, start_table_lock_wait_noop,
end_table_lock_wait_noop, unlock_table_noop};

PSI_table_service_t *psi_table_service = &psi_table_noop;
原文标题:Are some MySQL wait events actually CPU time ?
原文作者:khailey
原文地址:http://datavirtualizer.com/are-some-mysql-wait-events-actually-cpu-time/
