


APPLIES TO:
Oracle Database - Enterprise Edition - Version 12.1.0.2 to 12.1.0.2 [Release 12.1]
Oracle Database Cloud Schema Service - Version N/A and later
Oracle Database Exadata Express Cloud Service - Version N/A and later
Oracle Database Exadata Cloud Machine - Version N/A and later
Oracle Cloud Infrastructure - Database Service - Version N/A and later
Information in this document applies to any platform.
SYMPTOMS
-
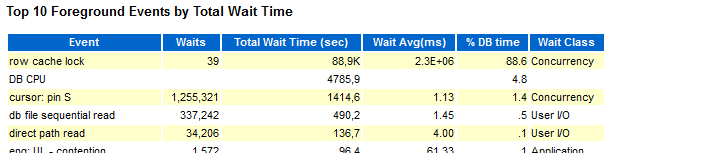
Session waits for ‘row cache lock’:
-
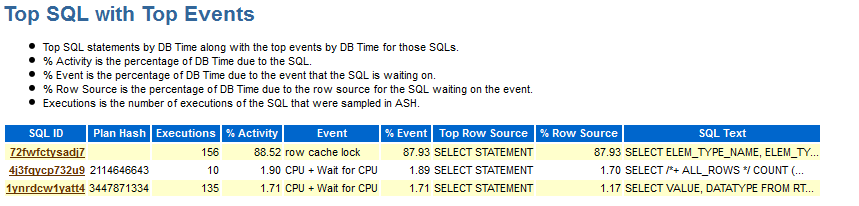
Active Session History (ASH) report identifies the top SQL waiting for the event:
-
Query has a SQL Plan Baseline defined for it
-
The parsing session is on CPU (Not in wait):
    (session) sid: 2180 ser: 25072 trans: 0x7000110e7eadad0, creator: 0x7000110c16ba308
    flags: (0x45) USR/- flags\_idl: (0x1) BSY/-/-/-/-/-
    flags2: (0x40009) -/-/INC
    DID: 0001-0221-0000008B, short-term DID: 0000-0000-00000000
    txn branch: 0x0
    edition#: 100 user#/name: .x.x.x.x.x.x.x.x.x.
    oct: 3, prv: 0, **sql: 0x700010ffee97498**, psql: 0x700010fce960ac0
    stats: 0x7000110ddfdfa60, PX stats: 0x111b1974c
    ksuxds FALSE at location: 0
    service name: SYS$USERS
    client details:
    O/S info: user: xxxxxxxx, term: unknown, ospid: 1234
    machine: xx12xx12xx12 program: JDBC Thin Client
    application name: JDBC Thin Client, hash value=2546894660
    Current Wait Stack:
    **Not in wait**; last wait ended 1 min 13 sec ago
    There are 148 sessions blocked by this session.
The session can be identified from the SQL: (**sql: 0x700010ffee97498**)

 **User=700011081a1d938 Session=700011081a1d938 ReferenceCount=1
       Flags=CNB/\[0001\] SavepointNum=5587618e
     LibraryHandle:  Address=700010ffee97498 Hash=7d853627 LockMode=N PinMode=0 LoadLockMode=0 Status=VALD
       ObjectName:  Name=**SELECT ELEM\_TYPE\_NAME, ELEM\_TY.... **FullHashValue=89605e026d885c4e713b8e667d853627 Namespace=SQL AREA(00) Type=CURSOR(00) ContainerId=0 ContainerUid=0 Identifier=2105882151 OwnerIdn=959**


The session holds an exclusive(X) (**mode=X**)  'row cache lock' on '**SMO rowcache**':


SO: 0x7000110be0269a0, type: 90, owner: 0x7000110e7eadad0, flag: INIT/-/-/0x00 if: 0x1 c: 0x1
proc=0x7000110c16ba308, name=row cache enqueues, file=kqr.h LINE:2122 ID:, pg=0 conuid=0
row cache enqueue: count=1 session=700011081a1d938 object=7000110eda46fd8, mode=X
savepoint=0x11b
row cache parent object: addr=7000110eda46fd8 cid=25(**SMO rowcache**) conid=0 conuid=0
hash=4390382c typ=9 transaction=7000110e7eadad0 flags=00000201 inc=1, pdbinc=1
own=7000110eda470a8\[7000110be026a50,7000110be026a50\] wat=7000110eda470b8\[7000110dd363fe0,7000110eb9e1dd8\] **mode=X**
status=EMPTY/-/-/-/-/-/-/-/-


This results in waiters on 'row cache lock'
-
While parsing the SQL shows a stack containing the following modules:
qksanCopySegText <- qsmoLoadHeap2 < qsmoObjLoad
-
This causes a Higher Shared Pool memory allocation for the component ‘SMODI’:
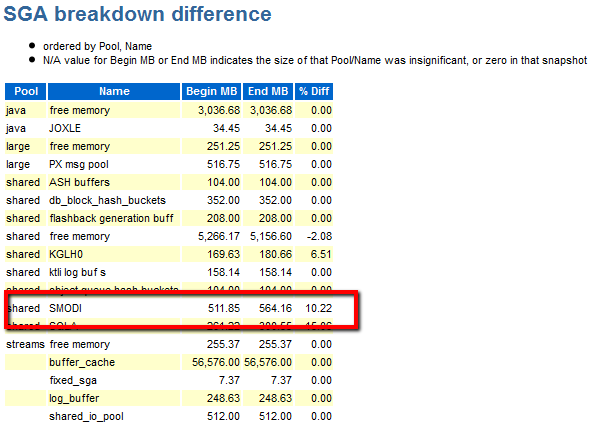
-
Dropping of SQL Plan Baseline that causes the issue may also be slow or appear to hang.
CHANGES
Database upgraded to 12.1.0.2 or SQL Plan Baseline added
CAUSE
This issue is caused by and unpublished bug.
For details refer to :
Document 20877664.8 Bug 20877664 SQL Plan Management Slow with High Shared Pool Allocations.
SOLUTION
Apply the patch for bug 20877664.
REFERENCES
NOTE:20877664.8 - Bug 20877664 - SQL Plan Management Slow with High Shared Pool Allocations
BUG:20758617 - LOAD SMO PLAN ROWS QUERY IS VERY EXPENSIVE IN 12.1.0.2
