


本文主要展示在R语言中如何利用ggplot2和gganimate包绘制动态散点图。绘图效果如下:
1、数据准备
使用gapminder包中的关于全球一百多个国家或地区的关于预期寿命(lifeExp)、人口数量(pop)、人均GDP(gdpPercap)的面板数据为例。
#install.packages("RColorBrewer")
#install.packages("gapminder")
#install.packages("gganimate")
#install.packages("ggplot2")
library(RColorBrewer)
library(gapminder)
library(gganimate)
library(ggplot2)

 head(gapminder)
# A tibble: 6 x 6
#  country     continent  year lifeExp      pop gdpPercap
#  <fct>       <fct>     <int>   <dbl>    <int>     <dbl>
#1 Afghanistan Asia       1952    28.8  8425333      779.
#2 Afghanistan Asia       1957    30.3  9240934      821.
#3 Afghanistan Asia       1962    32.0 10267083      853.
#4 Afghanistan Asia       1967    34.0 11537966      836.
#5 Afghanistan Asia       1972    36.1 13079460      740.
#6 Afghanistan Asia       1977    38.4 14880372      786.
> str(gapminder)
#tibble [1,704 x 6] (S3: tbl_df/tbl/data.frame)
# $ country  : Factor w/ 142 levels "Afghanistan",..: 1 1 1 1 1 1 1 1 1 1 ...
# $ continent: Factor w/ 5 levels "Africa","Americas",..: 3 3 3 3 3 3 3 3 3 3 ...
# $ year     : int [1:1704] 1952 1957 1962 1967 1972 1977 1982 1987 1992 1997 ...
# $ lifeExp  : num [1:1704] 28.8 30.3 32 34 36.1 ...
# $ pop      : int [1:1704] 8425333 9240934 10267083 11537966 13079460 14880372 12881816 13867957 16317921 22227415 ...
# $ gdpPercap: num [1:1704] 779 821 853 836 740 ...
2、图形绘制
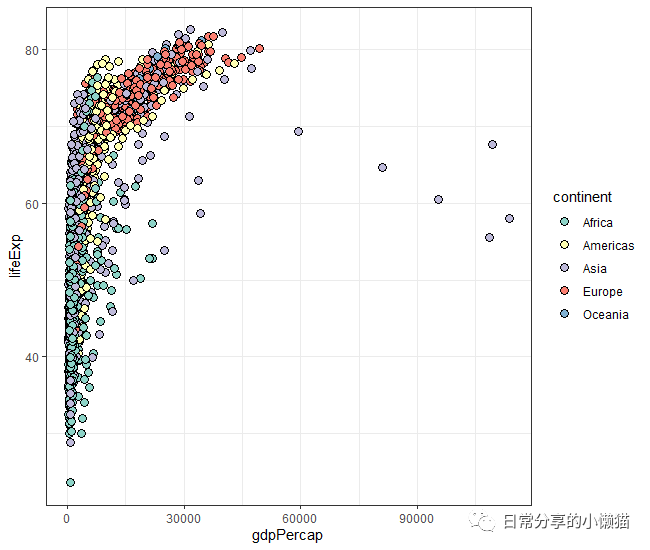
2.1 基本图形绘制
ggplot(data = gapminder ,aes(x =gdpPercap, y = lifeExp,  fill = continent )) +
  geom_point(shape = 21, color ="black", size = 3) +
  scale_fill_brewer(palette = "Set3") +
  theme_bw()
2.2 动态图绘制。利用gganimate包中transition_time() 绘图函数指定动态的变量。同时在绘制完成后可以利用gganimate包中anim_save("graph.gif") 函数,将动态图保存为gif格式。
ggplot(data = gapminder ,aes(x =gdpPercap, y = lifeExp,  fill = continent )) +
  geom_point(shape = 21, color ="black", size = 3) +
  scale_fill_brewer(palette = "Set3") +
  theme_bw() +
  labs(title = 'Year: {frame_time}', x = 'Per.GDP', y = 'lifeExp') +
  transition_time(year)
anim_save("Trend_gapminder.gif")

2.3 动态图修饰。通过加入shadow_wake() 绘图函数可以进一步展示点的运动轨迹。
ggplot(data = gapminder ,aes(x =gdpPercap, y = lifeExp,  fill = continent )) +
  geom_point(shape = 21, color ="black", size = 3) +
  scale_fill_brewer(palette = "Set3") +
  theme_bw() +
  labs(title = 'Year: {frame_time}', x = 'Per.GDP', y = 'lifeExp') +
  transition_time(year) +
  shadow_wake(wake_length = 0.5)
anim_save("Trend_gapminder2.gif")
3、其他
关于gganimate[1]包的更多内容可阅读参考文档。关于动态折线图的绘制可参考R语言绘图|动态折线图。更多绘图方法可阅读公众号其他推文。
如有帮助请多多点赞哦!
参考资料
gganimate: https://cran.r-project.org/web/packages/gganimate/gganimate.pdf
文章转载自日常分享的小懒猫,如果涉嫌侵权,请发送邮件至:contact@modb.pro进行举报,并提供相关证据,一经查实,墨天轮将立刻删除相关内容。
