


缺失值是数据处理过程中无可避免的一道难题,对于缺失值的处理也存在多种方法。本文主要以R语言
为例,展示缺失值的查找、探索、删除及填补等操作。
0、演示数据
使用dplyr
包中的关于电影星球大战
数据集,该数据集共有87个观测值和14个观测变量,包含name
,height
,mass
,hair_color
, sex
等。
library(tidyverse)
library(VIM)
library(mice)
data("starwars")
head(starwars)
# A tibble: 6 x 14
#  name           height  mass hair_color  skin_color  eye_color birth_year sex #   gender    homeworld species films  vehicles  starships
#  <chr>           <int> <dbl> <chr>       <chr>       <chr>          <dbl> <chr>  <chr>     <chr>     <chr>   <list> <list>    <list>
#1 Luke Skywalker    172    77 blond       fair        blue            19   male   masculine Tatooine  Human   <chr>  <chr [2]> <chr [2]>
#2 C-3PO             167    75 NA          gold        yellow         112   none   masculine Tatooine  Droid   <chr>  <chr [0]> <chr [0]>
#3 R2-D2              96    32 NA          white, blue red             33   none   masculine Naboo     Droid   <chr>  <chr [0]> <chr [0]>
#4 Darth Vader       202   136 none        white       yellow          41.9 male   masculine Tatooine  Human   <chr>  <chr [0]> <chr [1]>
#5 Leia Organa       150    49 brown       light       brown           19   female feminine  Alderaan  Human   <chr>  <chr [1]> <chr [0]>
#6 Owen Lars         178   120 brown, grey light       blue            52   male   masculine Tatooine  Human   <chr>  <chr [0]> <chr [0]>
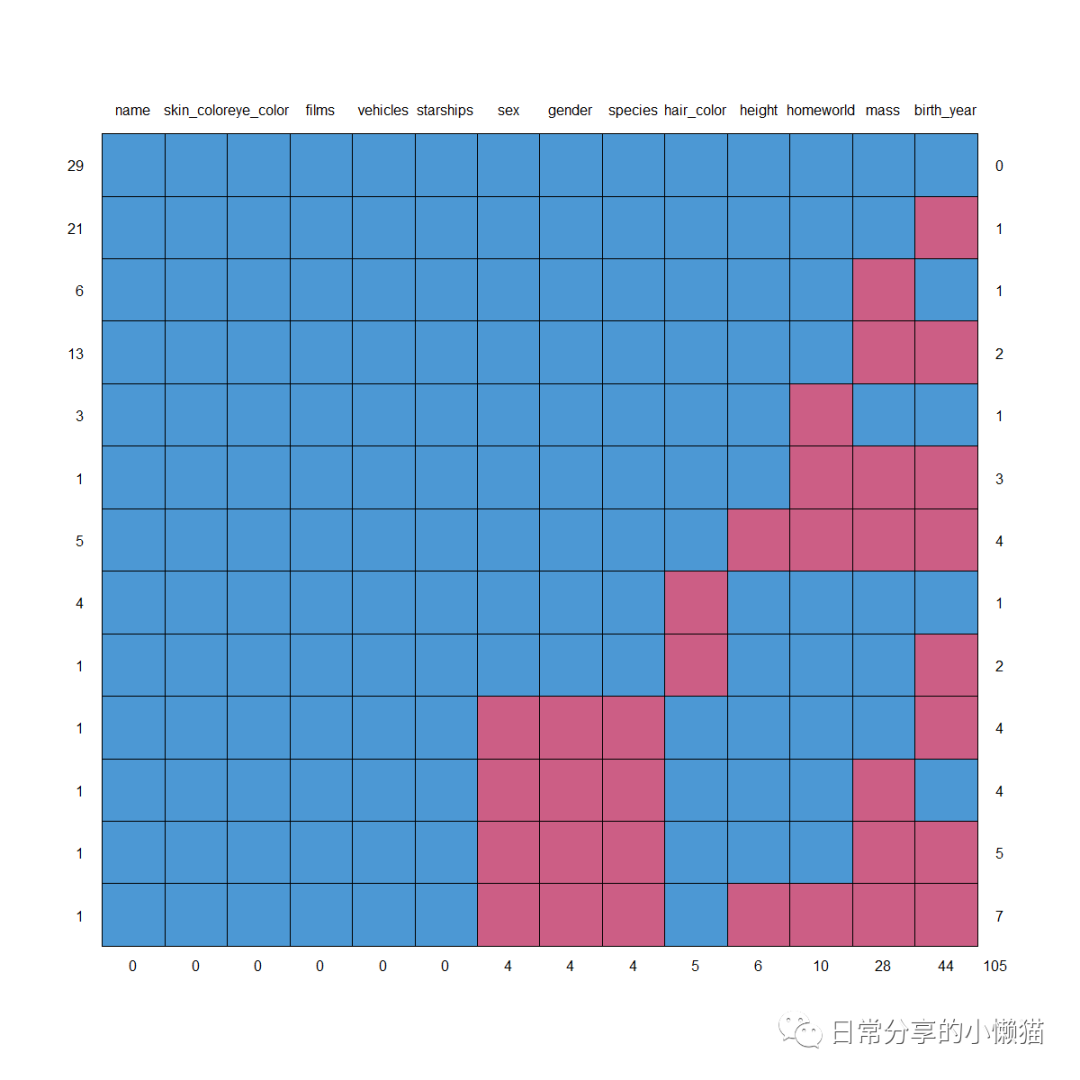
1、缺失值的查找
缺失值的查看可利用mice
包中的md.pattern()
函数,以及VIM
包中的aggr()
函数。二者在输出和表达上内容基本一致。
1.1 利用
mice
包中的md.pattern()
函数查看缺失值。
该函数会自动生成一个关于缺失值的数据及图形。数据中,0表示含有缺失值,1表示没有缺失值,第一列为没有缺失值的案例数,最后一列为缺失值变量的个数,最后一行为该变量缺失值的个数。图形为数据的可视化呈现。
mice::md.pattern(starwars)
#   name skin_color eye_color films vehicles starships sex gender species hair_color height homeworld mass birth_year
#29    1          1         1     1        1         1   1      1       1          1      1         1    1          1   0
#21    1          1         1     1        1         1   1      1       1          1      1         1    1          0   1
#6     1          1         1     1        1         1   1      1       1          1      1         1    0          1   1
#13    1          1         1     1        1         1   1      1       1          1      1         1    0          0   2
#3     1          1         1     1        1         1   1      1       1          1      1         0    1          1   1
#1     1          1         1     1        1         1   1      1       1          1      1         0    0          0   3
#5     1          1         1     1        1         1   1      1       1          1      0         0    0          0   4
#4     1          1         1     1        1         1   1      1       1          0      1         1    1          1   1
#1     1          1         1     1        1         1   1      1       1          0      1         1    1          0   2
#1     1          1         1     1        1         1   0      0       0          1      1         1    1          0   4
#1     1          1         1     1        1         1   0      0       0          1      1         1    0          1   4
#1     1          1         1     1        1         1   0      0       0          1      1         1    0          0   5
#1     1          1         1     1        1         1   0      0       0          1      0         0    0          0   7
#      0          0         0     0        0         0   4      4       4          5      6        10   28         44 105
1.2 利用
VIM
包中的aggr()
函数查看缺失值。
该函数表达意思与mice
包中的md.pattern()
函数基本一致。
VIM::aggr(starwars, prop = FALSE, number = TRUE)
 利用
利用summary()
函数将该图形信息输出。
VIM::aggr(starwars, prop = FALSE, number = TRUE) %>% summary()
# Missings per variable:
#   Variable Count
#       name     0
#     height     6
#       mass    28
# hair_color     5
# skin_color     0
#  eye_color     0
# birth_year    44
#        sex     4
#     gender     4
#  homeworld    10
#    species     4
#      films     0
#   vehicles     0
 # starships     0
 #Missings in combinations of variables:
 #               Combinations Count   Percent
 #0:0:0:0:0:0:0:0:0:0:0:0:0:0    29 33.333333
 #0:0:0:0:0:0:0:0:0:1:0:0:0:0     3  3.448276
 #0:0:0:0:0:0:1:0:0:0:0:0:0:0    21 24.137931
 #0:0:0:0:0:0:1:1:1:0:1:0:0:0     1  1.149425
 #0:0:0:1:0:0:0:0:0:0:0:0:0:0     4  4.597701
 #0:0:0:1:0:0:1:0:0:0:0:0:0:0     1  1.149425
 #0:0:1:0:0:0:0:0:0:0:0:0:0:0     6  6.896552
 #0:0:1:0:0:0:0:1:1:0:1:0:0:0     1  1.149425
 #0:0:1:0:0:0:1:0:0:0:0:0:0:0    13 14.942529
 #0:0:1:0:0:0:1:0:0:1:0:0:0:0     1  1.149425
 #0:0:1:0:0:0:1:1:1:0:1:0:0:0     1  1.149425
 #0:1:1:0:0:0:1:0:0:1:0:0:0:0     5  5.747126
 #0:1:1:0:0:0:1:1:1:1:1:0:0:0     1  1.149425
1.3 计算缺失值的个数
利用is.na()
函数,可进一步计算缺失值个数以及缺失值在样本中占比。
is.na(starwars) %>% sum() #计算数据中缺失值总个数
#[1] 105
is.na(starwars$height) %>% sum() #计算数据中单个变量缺失值个数
#[1] 6
is.na(starwars) %>% mean() #缺失值占比
#[1] 0.0862069
2、缺失值的探索
此外,也可以探索一个变量的缺失是否跟另一变量有联系,本文以birth_year
是否缺失为例,比较对应的height
变量的大小。
boxplot(starwars$height ~ is.na(starwars$birth_year))
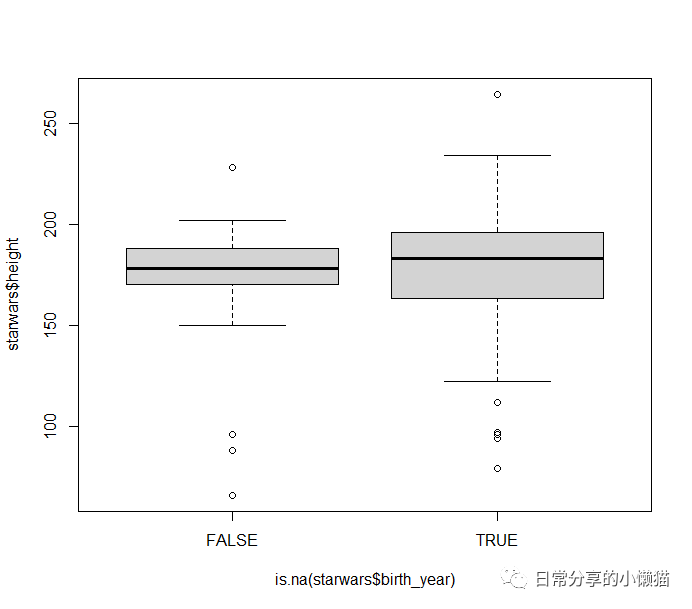 可以发现,当
birth_year
为缺失值时,height
的值更大一些。
3、缺失值的删除
缺失值的删除可使用drop_na()
函数和na.omit()
函数,二者效果一致。
new_data <- starwars %>% drop_na()
new_data <- starwars %>% na.omit()
4、缺失值的填补
本文以均值填补为例,进行缺失值的整体填补及分组填补。分组填补在面板数据中具有较大用处,可根据个体进行分组,然后根据不同个体的多年均值进行缺失值的替换。
4.1 整体填补
利用e1071
包中的impute()
函数进行均值填补,首先选择要填补的列,然后设置填补参数,what
参数用来制定填补方法,分为median
(中位数)和mean
(均值)。
library(e1071)
newdata3 <- e1071::impute(starwars[,c("height","mass", "birth_year")], what = "mean") %>% as.data.frame() #what = median或mean
4.2 整体填补
利用dplyr
中的%>%
管道操作符。
new_starwars1 <- starwars %>%
  select(height,mass, birth_year) %>%
  mutate(new_height =ifelse(!is.na(height),height, mean(height, na.rm = TRUE)),
         new_mass =ifelse(!is.na(mass),mass, mean(mass, na.rm = TRUE)),
         new_birth_year =ifelse(!is.na(birth_year),birth_year, mean(birth_year, na.rm = TRUE)))
new_starwars1
# A tibble: 87 x 6
#   height  mass birth_year new_height new_mass new_birth_year
#    <int> <dbl>      <dbl>      <dbl>    <dbl>          <dbl>
# 1    172    77       19          172       77           19
# 2    167    75      112          167       75          112
# 3     96    32       33           96       32           33
# 4    202   136       41.9        202      136           41.9
# 5    150    49       19          150       49           19
# 6    178   120       52          178      120           52
# 7    165    75       47          165       75           47
# 8     97    32       NA           97       32           87.6
# 9    183    84       24          183       84           24
#10    182    77       57          182       77           57
4.3 分组填补
以sex
变量为例,利用dplyr
中group_by()
函数, 展示分组填补过程。
new_starwars2 <-
  starwars %>% group_by(sex) %>%
  select(height,mass, birth_year) %>%
  mutate(new_height =ifelse(!is.na(height),height, mean(height, na.rm = TRUE)),
         new_mass =ifelse(!is.na(mass),mass, mean(mass, na.rm = TRUE)),
         new_birth_year =ifelse(!is.na(birth_year),birth_year, mean(birth_year, na.rm = TRUE)))
new_starwars2
# A tibble: 87 x 7
# Groups:   sex [5]
#   sex    height  mass birth_year new_height new_mass new_birth_year
#   <chr>   <int> <dbl>      <dbl>      <dbl>    <dbl>          <dbl>
# 1 male      172    77       19          172       77           19
# 2 none      167    75      112          167       75          112
# 3 none       96    32       33           96       32           33
# 4 male      202   136       41.9        202      136           41.9
# 5 female    150    49       19          150       49           19
# 6 male      178   120       52          178      120           52
# 7 female    165    75       47          165       75           47
# 8 none       97    32       NA           97       32           53.3
# 9 male      183    84       24          183       84           24
#10 male      182    77       57          182       77           57
# ... with 77 more rows
比较发现,第8个观测值所对应的birth_year
变量在整体均值填补
和分组均值填补
情况下呈现较大的差异性。
其他
其他方法可阅读公众号其他推文。关于缺失值的更多方法可阅读《R语言实战》(第二版)中的18章处理缺失数据的高级方法
。
