


在这篇文章[1] 我们介绍了 Prmetheus metrics 的基本类型和在 Golang 中的简单应用。我们知道在一个通过 Http 协议提供在线服务的应用中可以通过接口 /metrics
来 expose metrics,然后 promethues 可以通过定时 pull 的方式来抓取指标,这样可以实现服务的监控。那在一个不是通过 Http 接口来提供服务的应用我们如何做应用监控呢?比如在一个只从中间件中消费消息的 Python 应用怎么样通过 Promethues 实现应用监控就是在这篇文章中要介绍的内容。
收集 Metrics 的方式
Pull
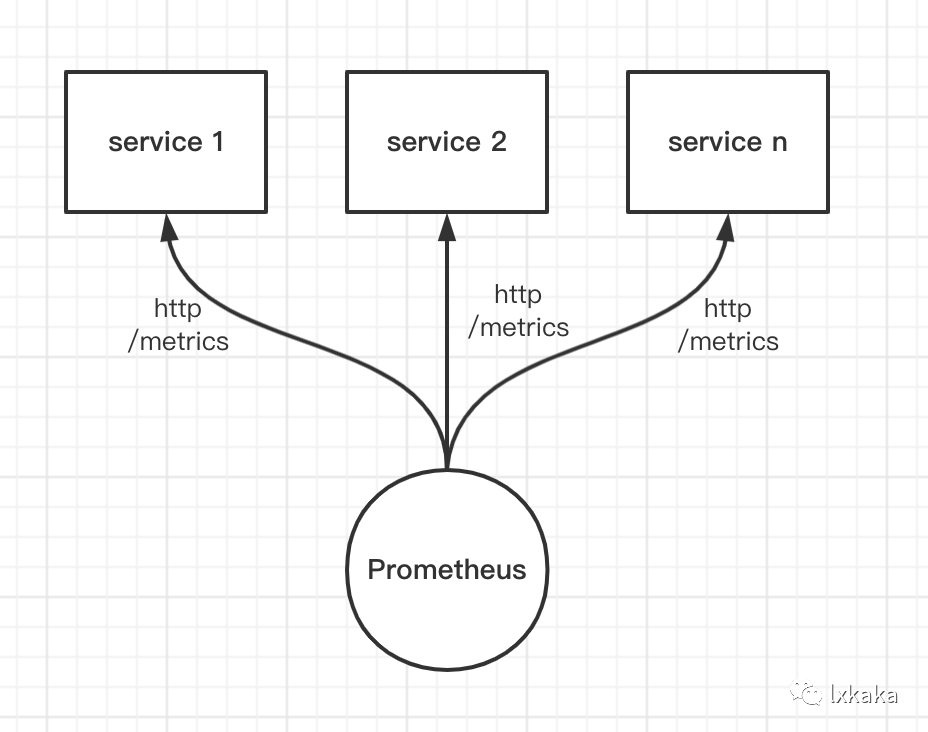
Prometheus 获取数据的方式只有拉取(PULL),即 Prometheus 会以固定频率去请求每个 target 所提供的 http url来获取数据。这就需要每个服务端点提供 http 的接口来获取实时的数据。就对应我们上面提到的通过提供接口 /metrics
。
Push
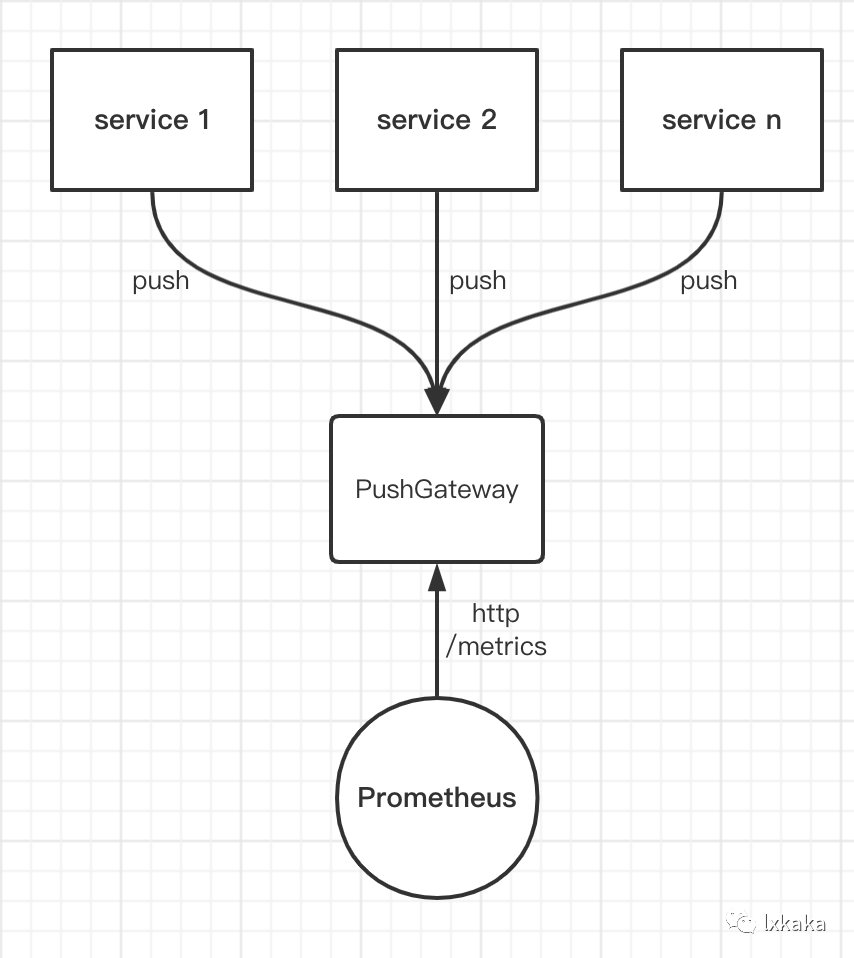
并不是所有的应用都能提供 http 接口,为了兼容这种场景 Promethues 也通过增加组件 PushGateway 实现了应用主动推送的方式。PushGateway 本质上就是一个代理服务,独立部署。它没有数据抓取功能,只能被动的等待数据推送。应用把数据推送到 PushGateway 后,Prometheus 再从 PushGateway抓取。
推送监控指标
我们看推送的方式如何实现,以监控任务中某一阶段的耗时这样一个例子实践
首先我们依赖 Promethues 的 Python 官方客户端[2]。
示例代码如下
#!/usr/bin/env python3# -*- coding: utf-8 -*-import randomimport threadingimport timefrom prometheus_client import CollectorRegistry, Histogram, push_to_gatewayclass Moni:registry = CollectorRegistry()h = Histogram('job_duration_seconds', 'duration of job', labelnames=['job_name'],buckets=[1, 2, 3, 10, 20, 50, 100], registry=registry)@classmethoddef push(cls):push_to_gateway('http://localhost:9091', job='moni', registry=cls.registry)@classmethoddef start(cls):def run():while True:cls.push()time.sleep(5)t = threading.Thread(target=run)t.daemon = Truet.start()def job_run():st = time.time()time.sleep(random.uniform(0, 10))duration = time.time() - stMoni.h.labels(job_name="test_job").observe(duration)print('模拟 job 运行: ', duration)def task():for i in range(10):print('模拟任务开始运行...')job_run()time.sleep(10)if __name__ == '__main__':Moni.start()task()
运行上面示例代码得到如下结果
/Users/lxkaka/bili/rubick-toys/venv/bin/python3 Users/lxkaka/bili/rubick-worker/test_metrics.py模拟任务开始运行...模拟 job 运行: 0.1491992473602295模拟任务开始运行...模拟 job 运行: 9.469422817230225模拟任务开始运行...模拟 job 运行: 3.0821011066436768模拟任务开始运行...模拟 job 运行: 4.389142990112305模拟任务开始运行...模拟 job 运行: 6.255290985107422模拟任务开始运行...模拟 job 运行: 8.34602689743042模拟任务开始运行...模拟 job 运行: 0.5739247798919678模拟任务开始运行...模拟 job 运行: 5.111149072647095模拟任务开始运行...模拟 job 运行: 2.314656972885132模拟任务开始运行...模拟 job 运行: 3.758761405944824Process finished with exit code 0
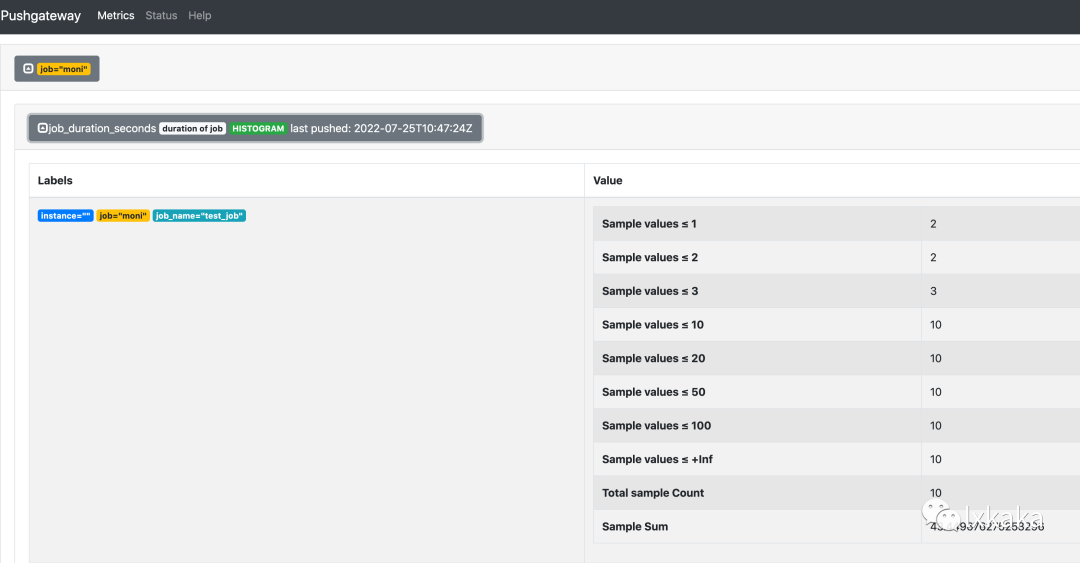
下面的图展示了在 PushGateway 中收集到的结果,可以看到 metrics 和上面输出完全一致
此外 prometheus_client
提供了更方便的使用方式--装饰器,可以更优雅的实现指标监控,以上面的示例为例修改如下:
h_label = Moni.h.labels(job_name='test_job')@h_label.time()def job_run():time.sleep(random.uniform(0, 10))
其他指标类型的装饰器比如
from prometheus_client import Counter, Gaugec = Counter('my_failures', 'Description of counter')@c.count_exceptions()def f():passg = Gauge('my_inprogress_requests', 'Description of gauge')@g.track_inprogress()def f():pass
拉取监控指标
在任务类型的应用中虽然没有现成的 Http server,但我们可以在任务进程中起一个子线程去启动一个 Http server, 这个 server 提供接口给 Promethues 拉取指标。在 prometheus_client
已经提供了 start_http_server
方法来启动一个后台 Http Server。使用示例如下
#!/usr/bin/env python3# -*- coding: utf-8 -*-# !/usr/bin/env python3# -*- coding: utf-8 -*-import randomimport timefrom prometheus_client import Histogram, start_http_serverclass Moni:h = Histogram('job_duration_seconds', 'duration of job', labelnames=['job_name'],buckets=[1, 2, 3, 10, 20, 50, 100])@classmethoddef start(cls):start_http_server(8000)h_label = Moni.h.labels(job_name='test_job')@h_label.time()def job_run():time.sleep(random.uniform(0, 10))def task():for i in range(10):print('模拟任务开始运行...')job_run()time.sleep(100)if __name__ == '__main__':Moni.start()task()
容器的 health check 配置上此端口,提高监控的可用性。查看接口,输出结果如下
# HELP job_duration_seconds duration of job# TYPE job_duration_seconds histogramjob_duration_seconds_bucket{job_name="test_job",le="1.0"} 2.0job_duration_seconds_bucket{job_name="test_job",le="2.0"} 2.0job_duration_seconds_bucket{job_name="test_job",le="3.0"} 2.0job_duration_seconds_bucket{job_name="test_job",le="10.0"} 10.0job_duration_seconds_bucket{job_name="test_job",le="20.0"} 10.0job_duration_seconds_bucket{job_name="test_job",le="50.0"} 10.0job_duration_seconds_bucket{job_name="test_job",le="100.0"} 10.0job_duration_seconds_bucket{job_name="test_job",le="+Inf"} 10.0job_duration_seconds_count{job_name="test_job"} 10.0
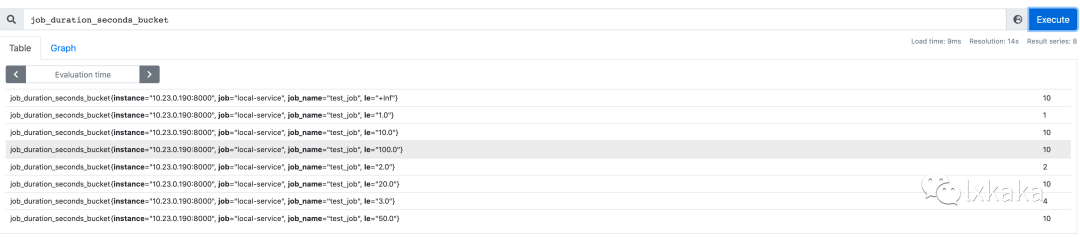
在 Promethues 中查看抓取结果如下图所示
此外,当我们的 Python 应用包含多个进程,上述的方式就不能 work 了。关于如何在多进程中 expose metrics 我们后续更新到文章中。
References
[1]
这篇文章: https://www.lxkaka.wang/app-metrics/[2]
官方客户端: https://github.com/prometheus/client_python
