


作者简介
马听,多年 DBA 实战经验,对 MySQL、 Redis、ClickHouse 等数据库有一定了解,专栏《一线数据库工程师带你深入理解 MySQL》、《Redis 运维实战》作者。
1 架构图
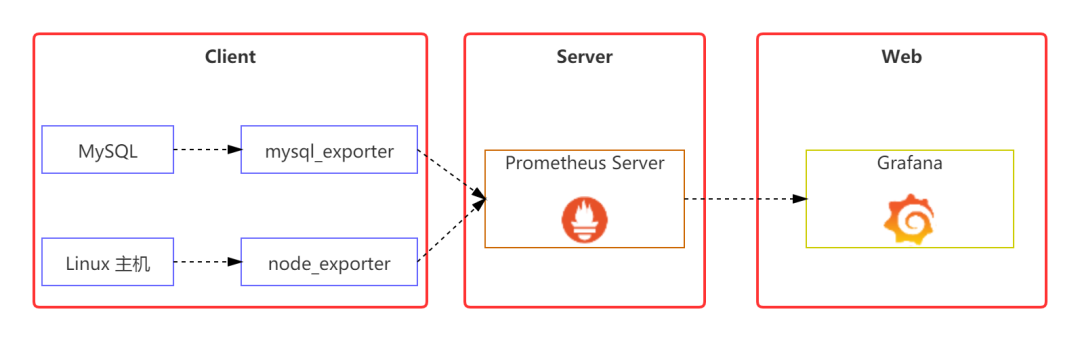
2 实验环境介绍
被监控的 MySQL 机器:192.168.150.123(MySQL 版本:8.0.22);
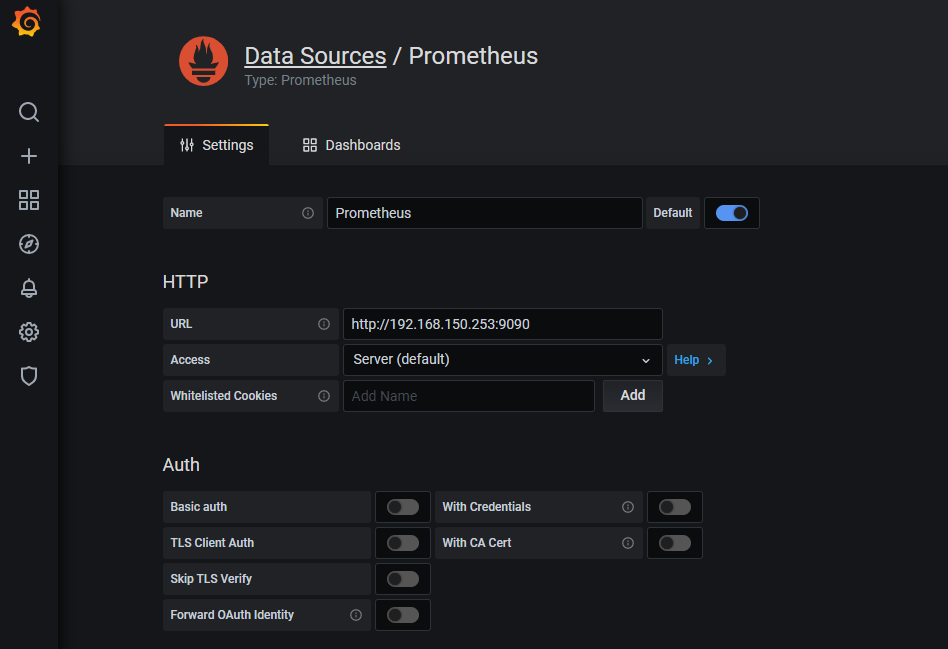
Prometheus 服务器:192.168.150.253(Prometheus 版本:2.25.2);
Grafana 服务器:192.168.21.126(Grafana 版本:7.4.5);
服务器版本均为:CentOS 7.4;
防火墙、Selinux 均关闭。
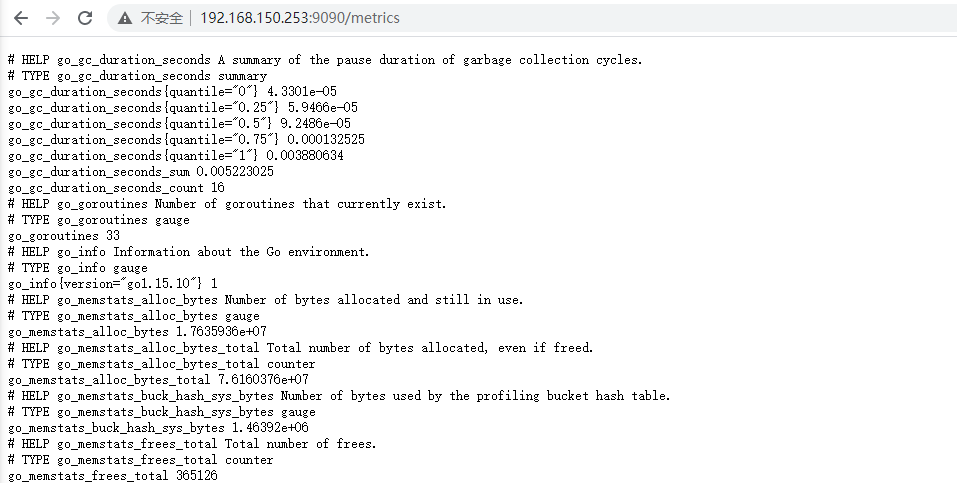
3 部署 Prometheus
tar zxvf prometheus-2.25.2.linux-amd64.tar.gz -C opt
ln -s /opt/prometheus-2.25.2.linux-amd64/ /opt/prometheus
# my global configglobal:scrape_interval: 15s # Set the scrape interval to every 15 seconds. Default is every 1 minute.evaluation_interval: 15s # Evaluate rules every 15 seconds. The default is every 1 minute.# scrape_timeout is set to the global default (10s).# Alertmanager configurationalerting:alertmanagers:- static_configs:- targets:# - alertmanager:9093# Load rules once and periodically evaluate them according to the global 'evaluation_interval'.rule_files:# - "first_rules.yml"# - "second_rules.yml"# A scrape configuration containing exactly one endpoint to scrape:# Here it's Prometheus itself.scrape_configs:# The job name is added as a label `job=<job_name>` to any timeseries scraped from this config.- job_name: 'prometheus'# metrics_path defaults to '/metrics'# scheme defaults to 'http'.static_configs:- targets: ['192.168.150.253:9090']
nohup opt/prometheus/prometheus --config.file=/opt/prometheus/prometheus.yml &
4 部署 node_exporter 组件
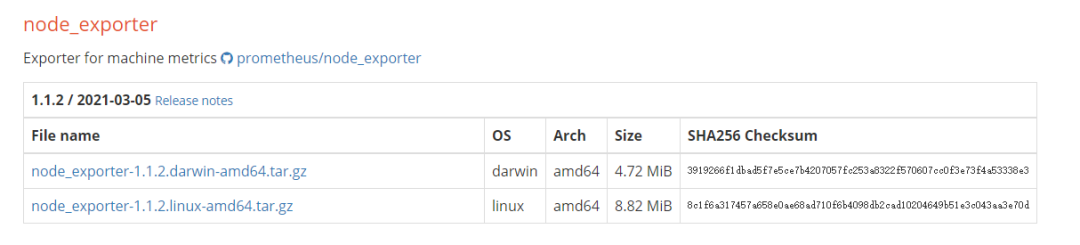
tar zxvf node_exporter-1.1.2.linux-amd64.tar.gz -C opt/
创建软链接:
ln -s /opt/node_exporter-1.1.2.linux-amd64/ /opt/node_exporter
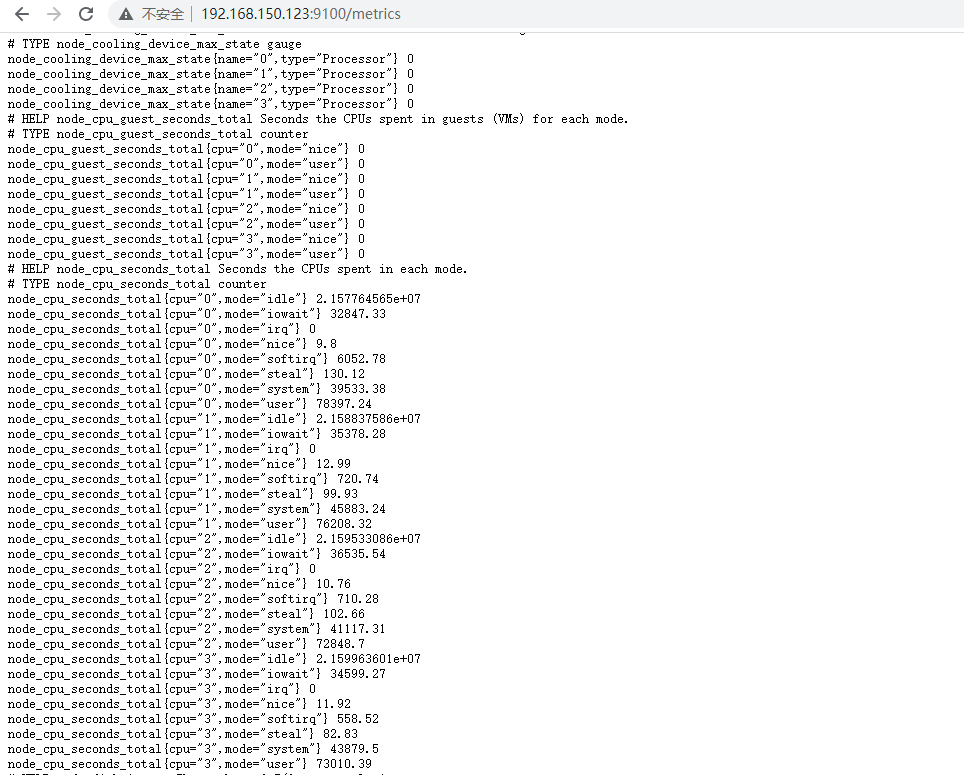
nohup /opt/node_exporter/node_exporter &
5 部署 mysqld_exporter 组件
tar zxvf mysqld_exporter-0.12.1.linux-amd64.tar.gz -C /opt
ln -s /opt/mysqld_exporter-0.12.1.linux-amd64/ /opt/mysqld_exporter
create user 'exporter'@'localhost' IDENTIFIED BY 'eXpIHB666QWE!';GRANT SELECT, PROCESS, SUPER, REPLICATION CLIENT, RELOAD ON *.* TO 'exporter'@'localhost';
vim /opt/mysqld_exporter/mysqld_exporter.cnf
[client]user=exporterpassword=eXpIHB666QWE!
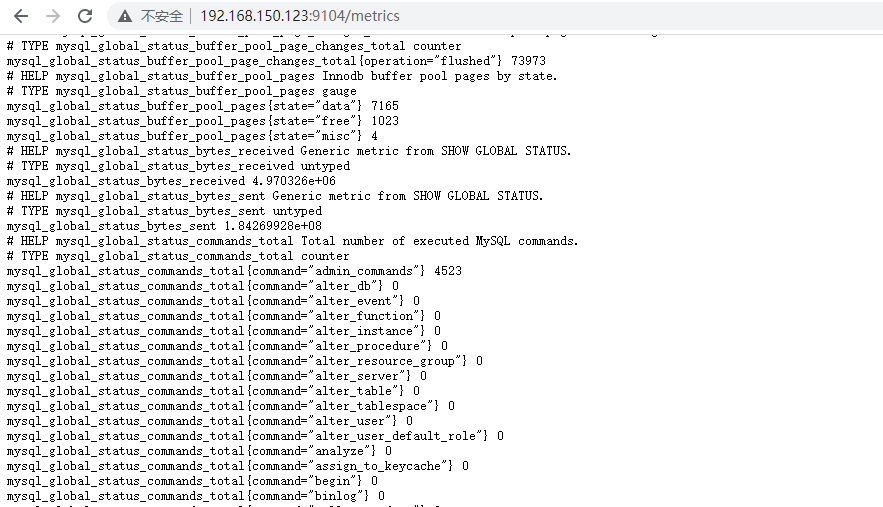
nohup opt/mysqld_exporter/mysqld_exporter --config.my-cnf=/opt/mysqld_exporter/mysqld_exporter.cnf &
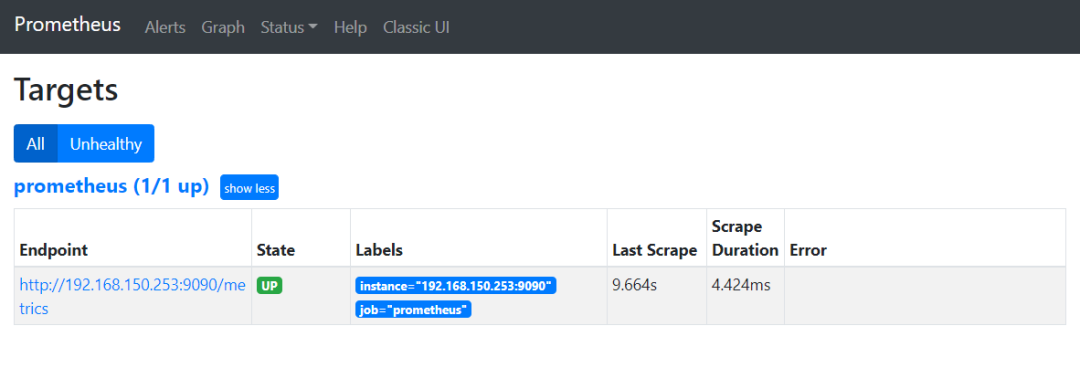
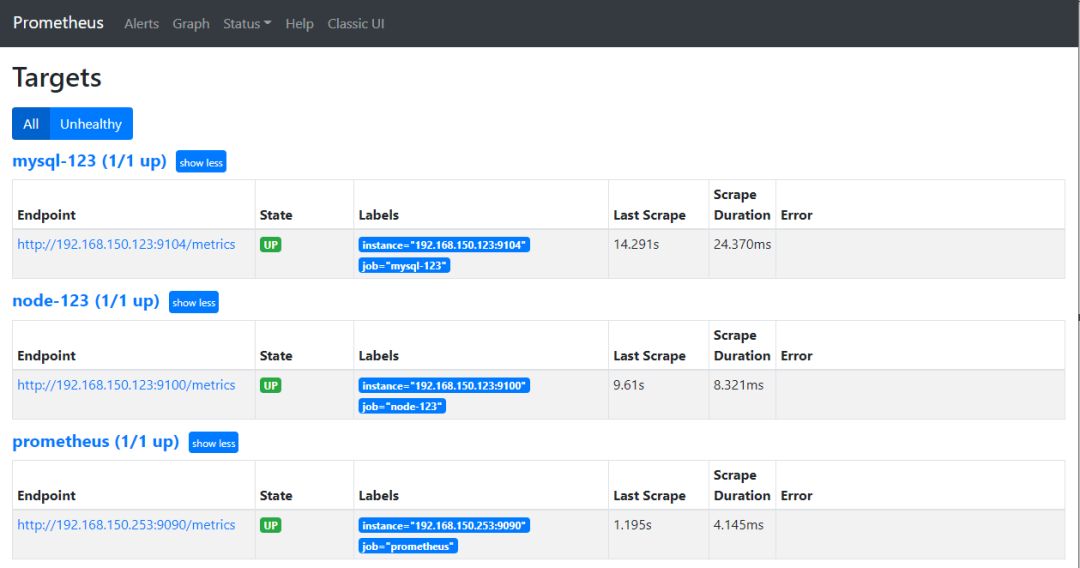
6 配置 Prometheus 获取监控数据
# my global configglobal:scrape_interval: 15s # Set the scrape interval to every 15 seconds. Default is every 1 minute.evaluation_interval: 15s # Evaluate rules every 15 seconds. The default is every 1 minute.# scrape_timeout is set to the global default (10s).# Alertmanager configurationalerting:alertmanagers:- static_configs:- targets:# - alertmanager:9093# Load rules once and periodically evaluate them according to the global 'evaluation_interval'.rule_files:# - "first_rules.yml"# - "second_rules.yml"# A scrape configuration containing exactly one endpoint to scrape:# Here it's Prometheus itself.scrape_configs:# The job name is added as a label `job=<job_name>` to any timeseries scraped from this config.- job_name: 'prometheus'# metrics_path defaults to '/metrics'# scheme defaults to 'http'.static_configs:- targets: ['192.168.150.253:9090']- job_name: 'mysql-123'static_configs:- targets: ['192.168.150.123:9104']- job_name: 'node-123'static_configs:- targets: ['192.168.150.123:9100']
pkill prometheusnohup opt/prometheus/prometheus --config.file=/opt/prometheus/prometheus.yml &
7 部署 Grafana
wget https://dl.grafana.com/oss/release/grafana-7.4.5-1.x86_64.rpmyum install grafana-7.4.5-1.x86_64.rpm -y
systemctl start grafana-server.service

用户名密码都是 admin。登录后,会让我们修改密码,则按提示操作即可,当然也可以点击跳过。
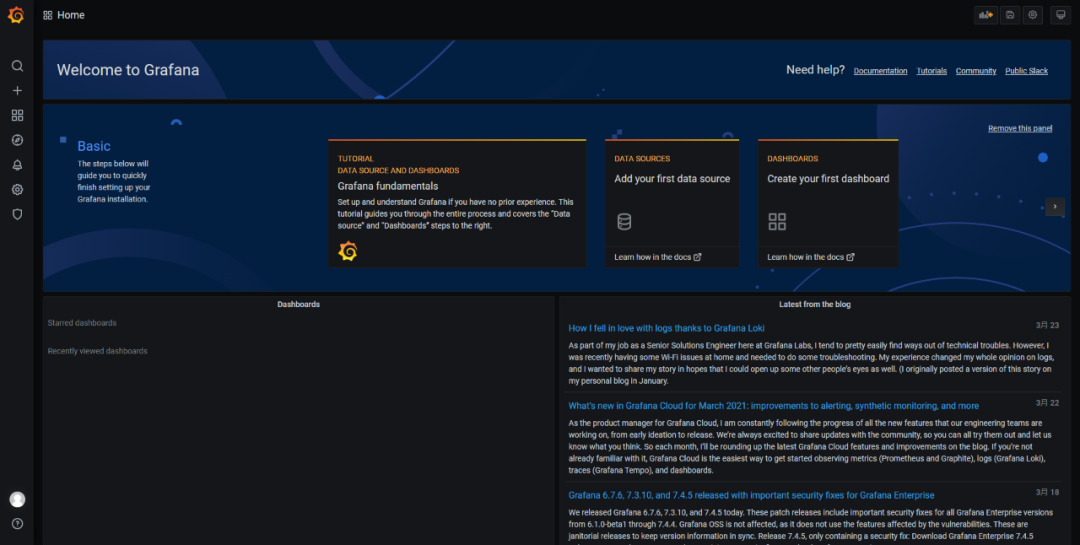
这里就可以看到 Grafana 的主界面了:
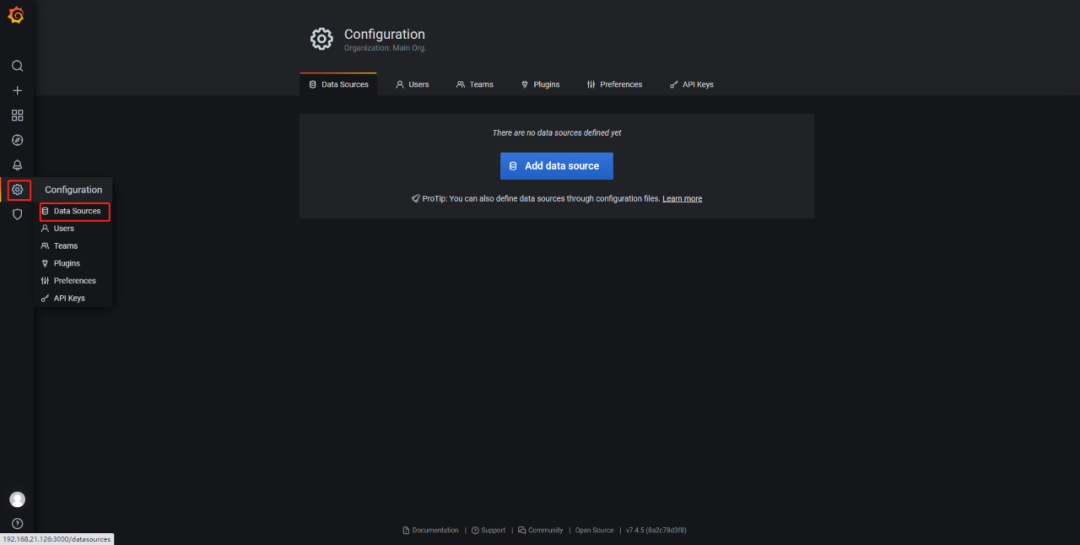
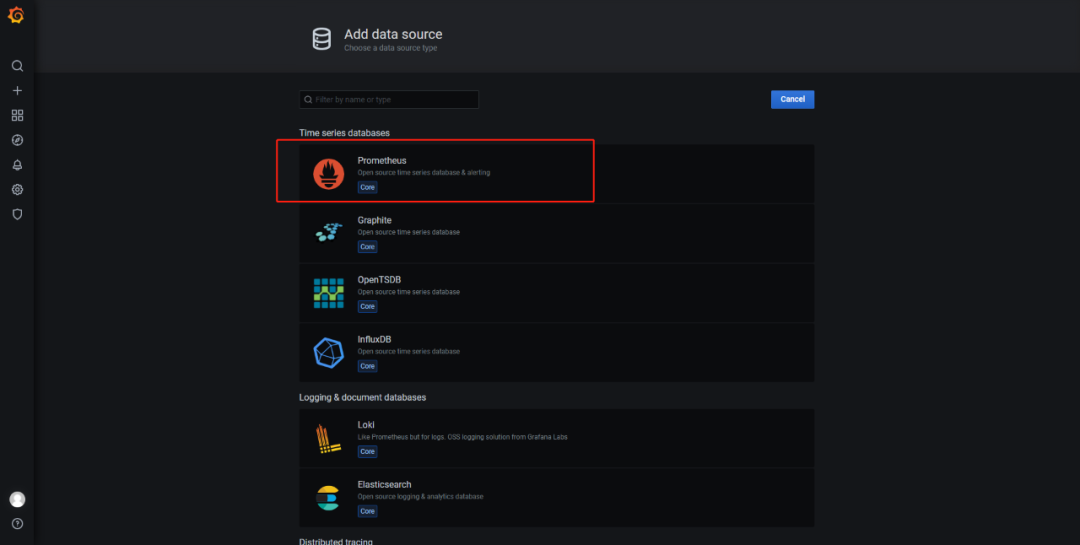
8 为 Grafana 配置 Prometheus 数据源

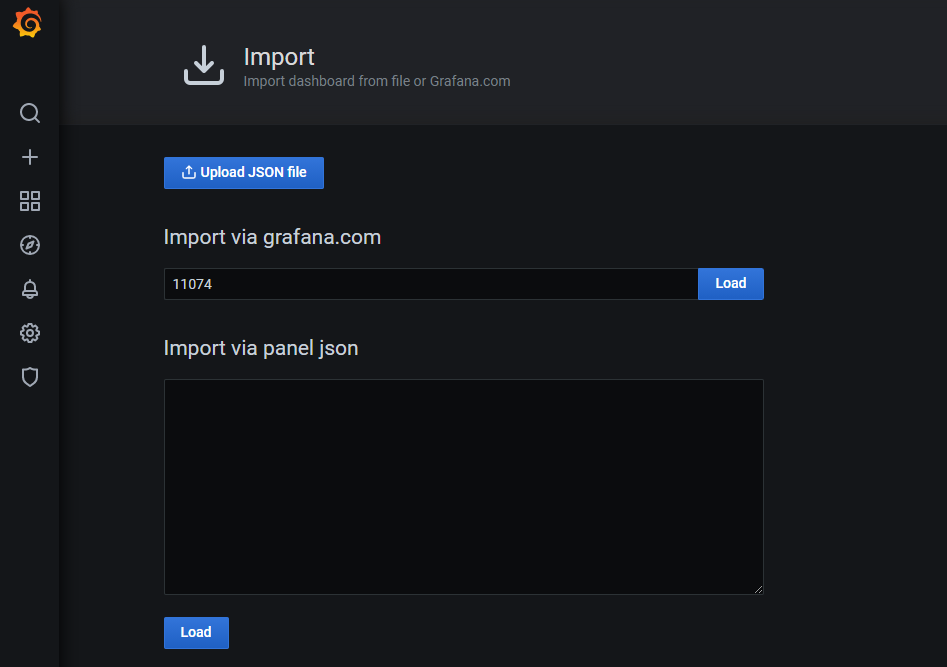
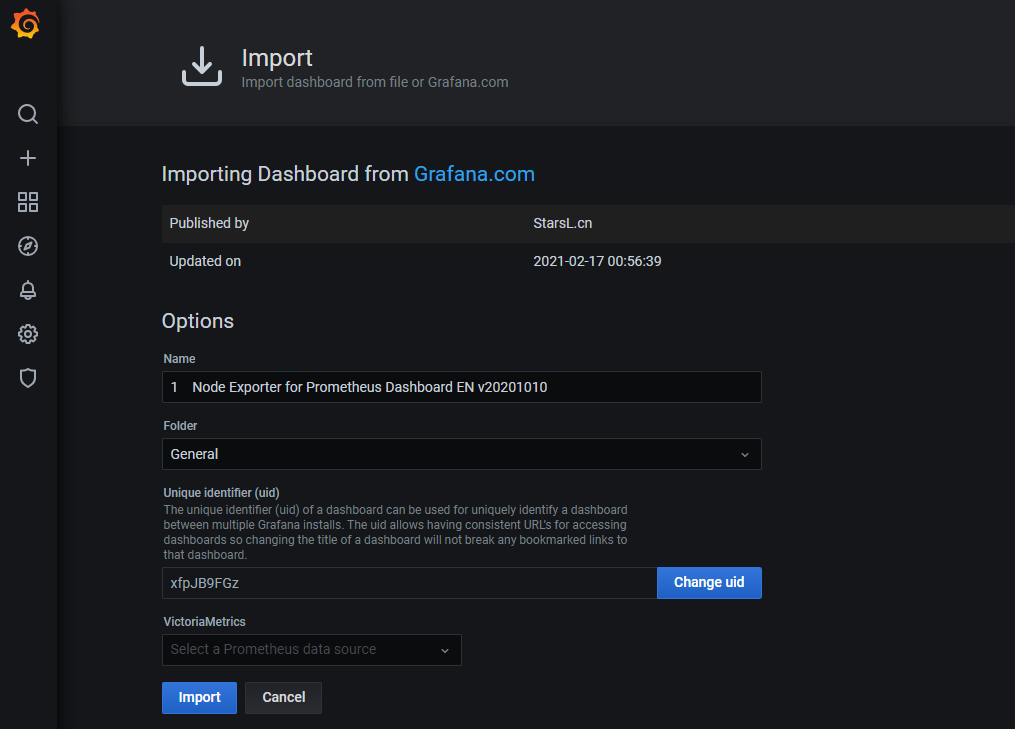
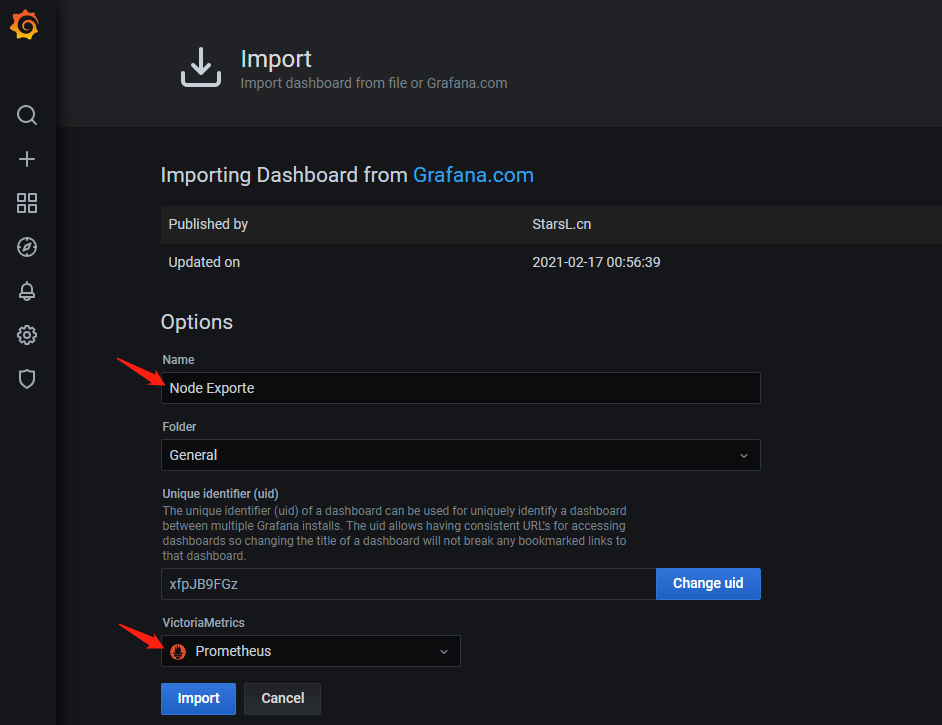
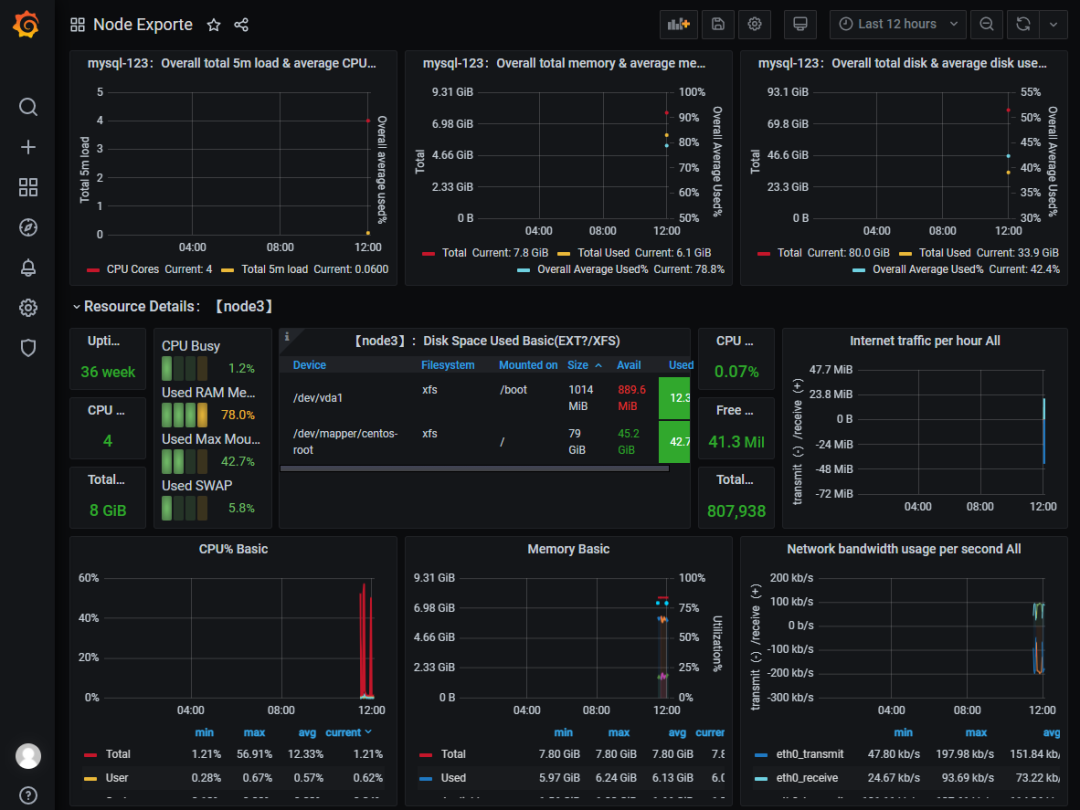
9 Grafana 展示 Linux 的监控数据
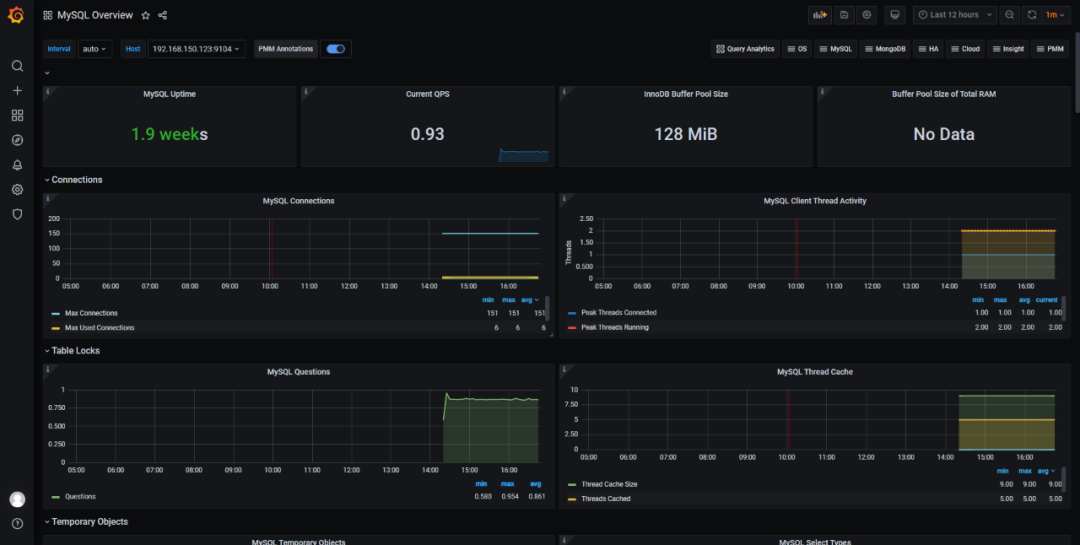
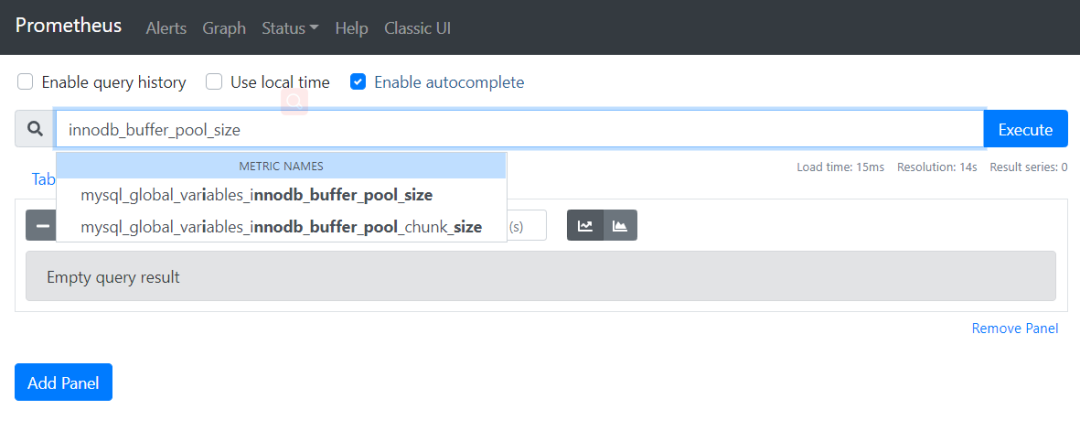
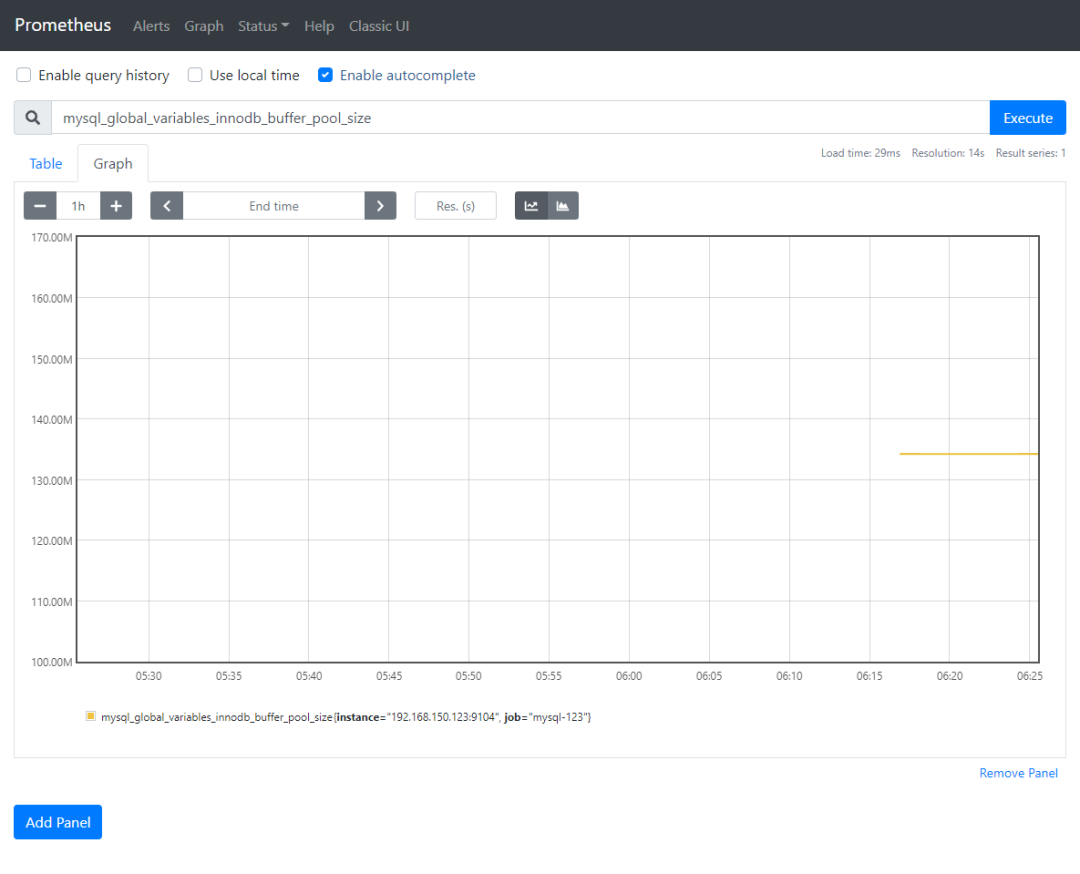
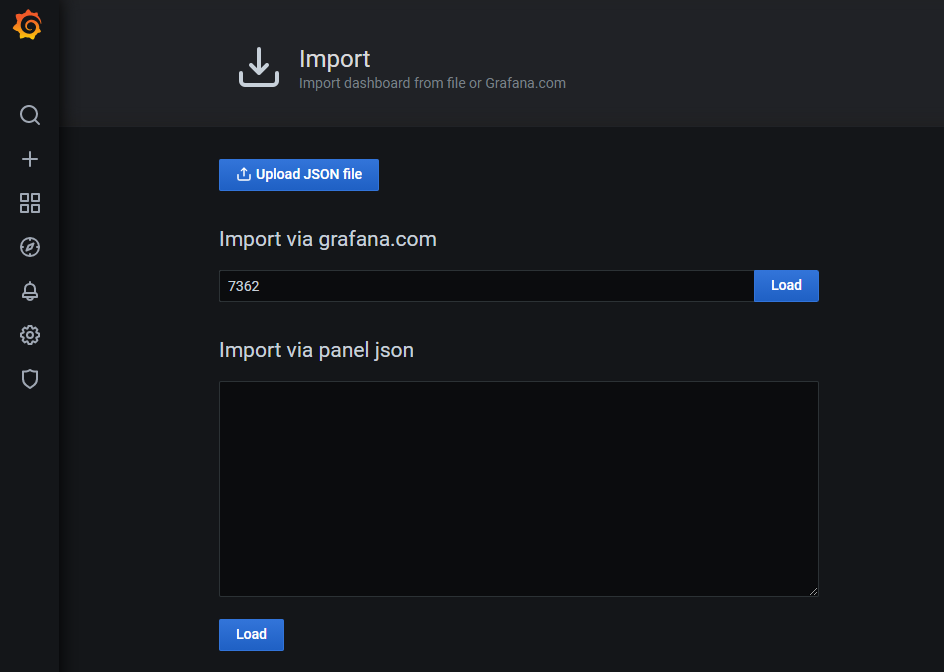
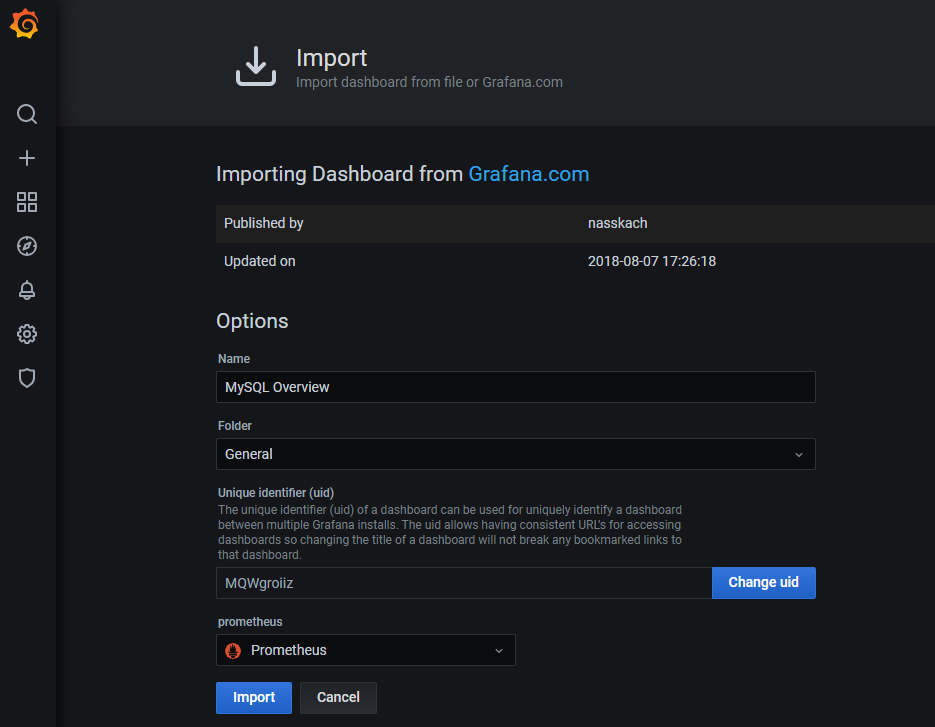
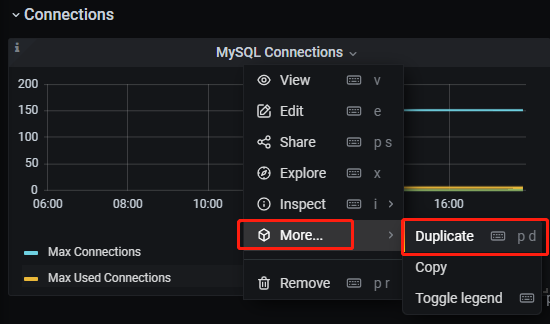
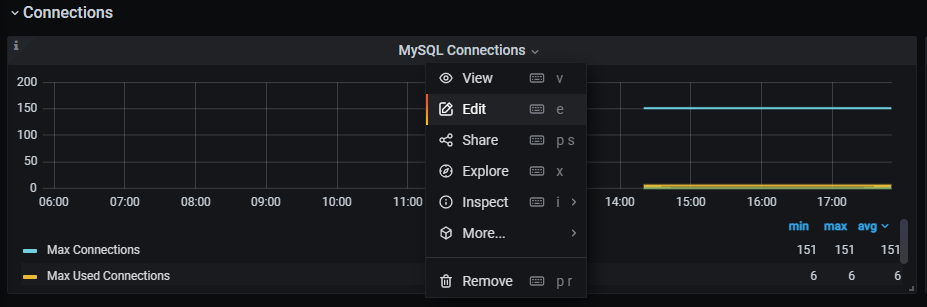
10 Grafana 展示 MySQL 的监控数据
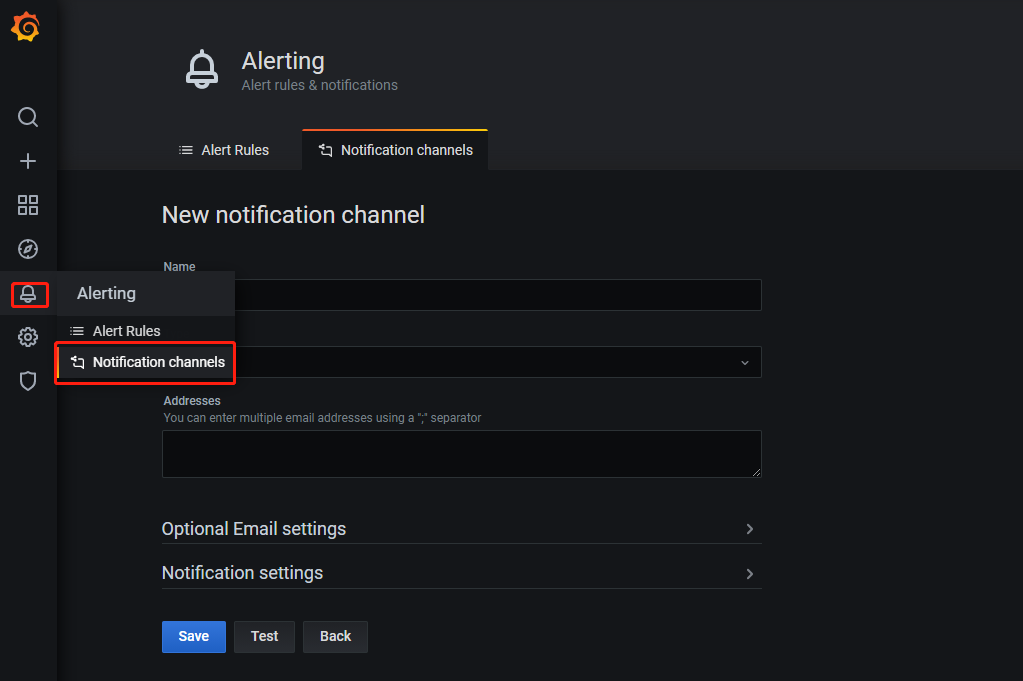
11 告警配置
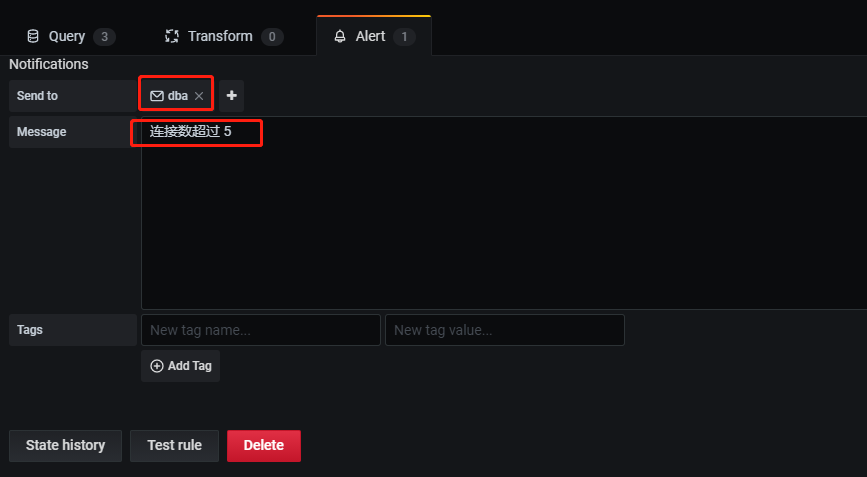
对 Prometheus 中获取的数据进行告警配置,目前有很多方式,比如:
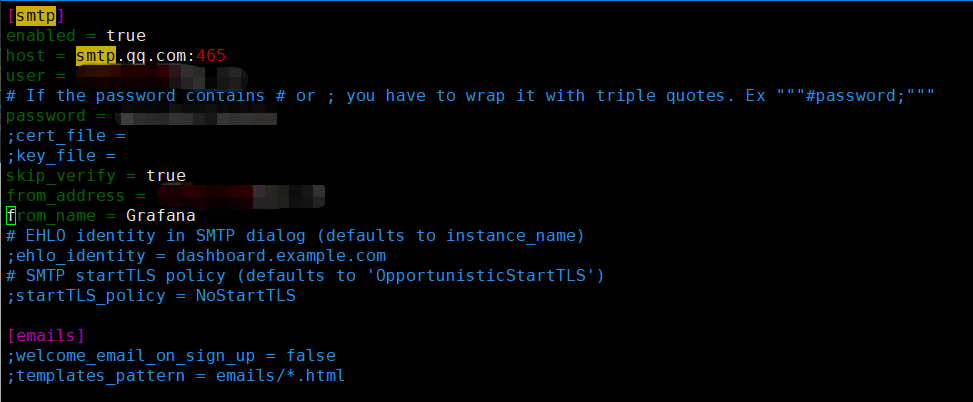
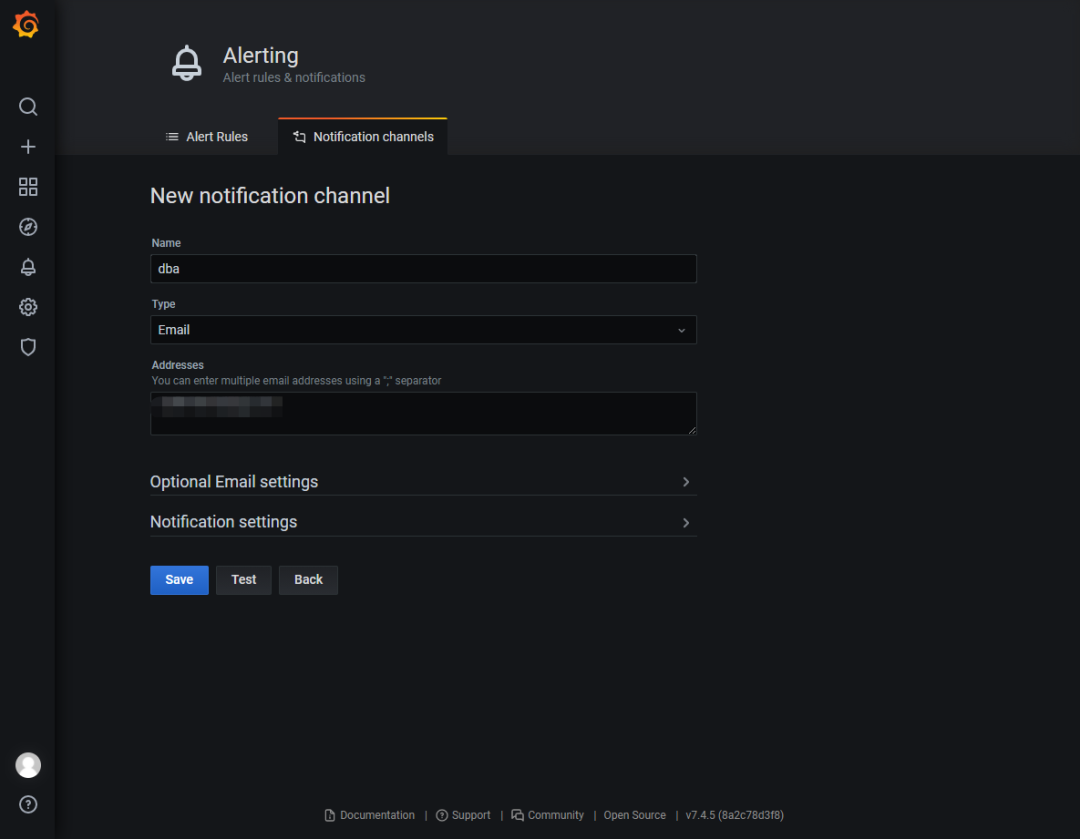
通过 Grafana 配置邮件告警
通过开源的运维告警中心消息转发系统:PrometheusAlert,Github 地址:https://github.com/pandorasongs/PrometheusAlert。
等等
systemctl start grafana-server.service
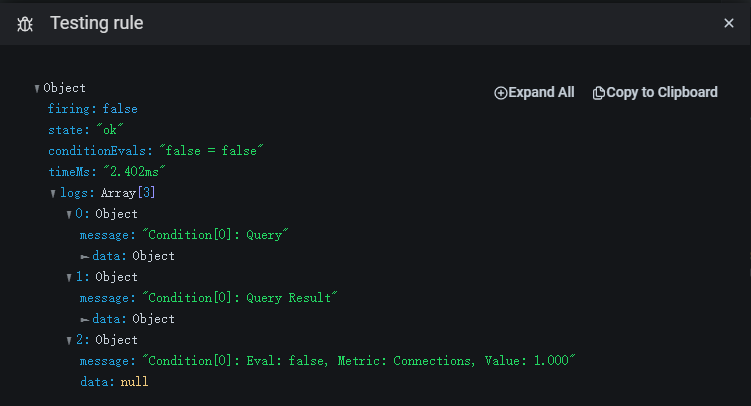
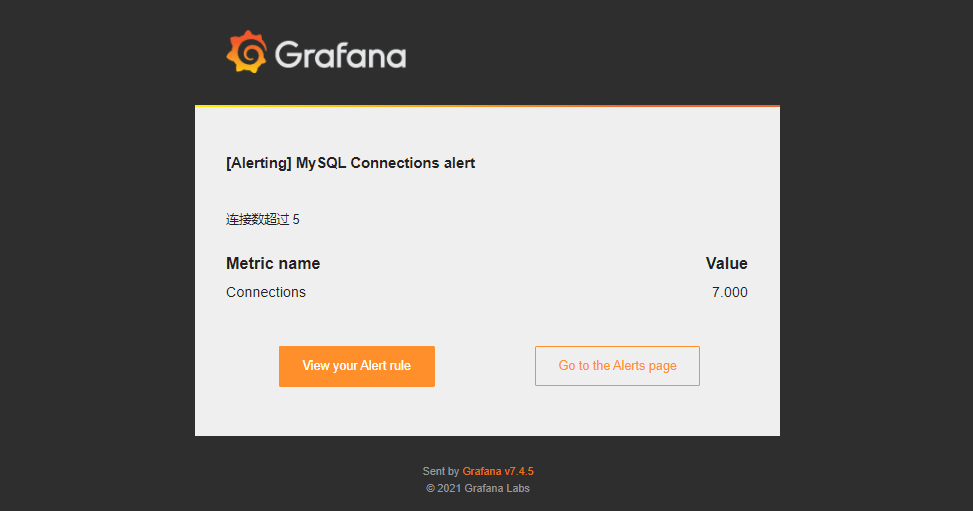
12 告警测试
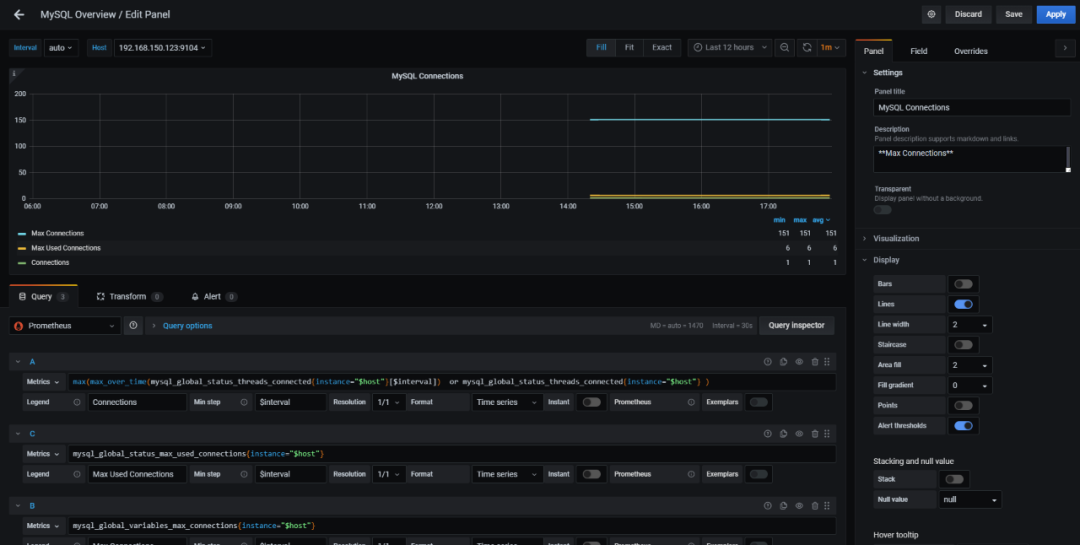
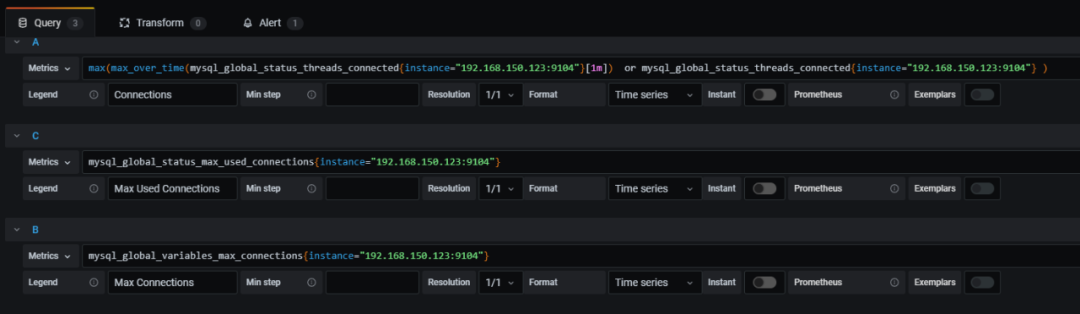
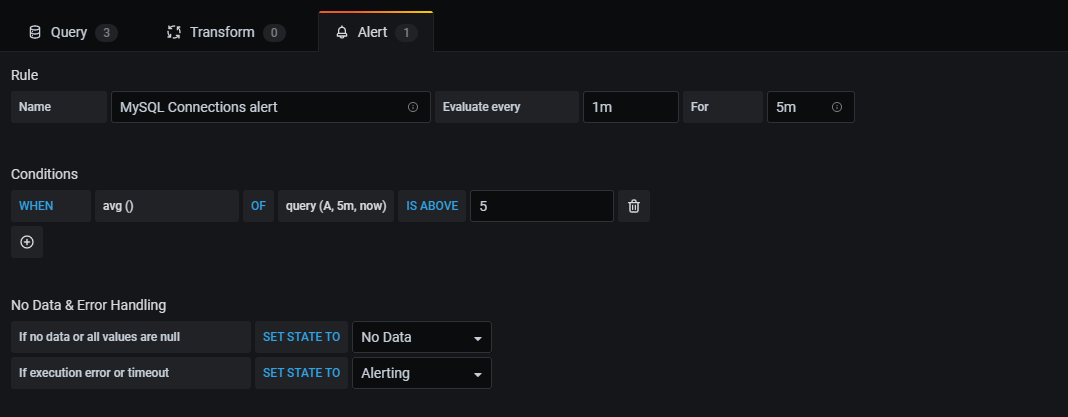
A 对 A 类(A 是 Query 中定义的)指标; 5m,now 表示从 5 分钟前到现在; IS ABOVE 5 定义阈值的类型和阈值。


文章转载自悦专栏,如果涉嫌侵权,请发送邮件至:contact@modb.pro进行举报,并提供相关证据,一经查实,墨天轮将立刻删除相关内容。
