


编者按:
本文作者系Scott(中文名陈晓辉),现任大连华信资深分析师 ,ORACLE数据库专家,曾就职于甲骨文中国。个人主页:segmentfault.com/u/db_perf ,经其本人授权发布。
【免责声明】本公众号文章仅代表个人观点,与任何公司无关。

今天借助一个例子继续讲ASH的用法。
客户报告:一个RAC构成的环境,在11:20左右开始处理慢。提供资料:AWR Report ASH 请求事项:原因确认解决方法
先简单看一AWR Report 的总体状况。
・Node1 DB Time: 967.74 (mins)・Node2 DB Time: 414.41 (mins)・Node3 DB Time: 354.11 (mins)・Node4 DB Time: 460.29 (mins)・Node5 DB Time: 551.66 (mins)
根据以上的信息,可以看到Node1的“DB Time : 967.74 (mins)”,Node2--Node5 的两倍左右。所以,我们可以看看每个INSTANCE的“Top 5 Timed Foreground Events”。
・Node1Top 5 Timed Foreground Events~~~~~~~~~~~~~~~~~~~~~~~~~~~~~ Avg wait % DBEvent Waits Time(s) (ms) time Wait Class------------------------------ ------------ ----------- ------ ------ ----------db file sequential read 4,893,299 26,714 5 46.0 User I/Olog file sync 476,854 6,132 13 10.6 CommitDB CPU 5,009 8.6Disk file operations I/O 163,640 4,128 25 7.1 User I/Ogc current block 3-way 2,866,969 3,163 1 5.4 Cluster・Node2Top 5 Timed Foreground Events~~~~~~~~~~~~~~~~~~~~~~~~~~~~~ Avg wait % DBEvent Waits Time(s) (ms) time Wait Class------------------------------ ------------ ----------- ------ ------ ----------gc cr block busy 256,891 4,668 18 18.8 ClusterDB CPU 4,613 18.6db file sequential read 3,089,328 3,822 1 15.4 User I/Ogc current block 3-way 2,533,718 2,717 1 10.9 Clustergc cr grant 2-way 2,424,954 1,698 1 6.8 Cluster・Node3Top 5 Timed Foreground Events~~~~~~~~~~~~~~~~~~~~~~~~~~~~~ Avg wait % DBEvent Waits Time(s) (ms) time Wait Class------------------------------ ------------ ----------- ------ ------ ----------DB CPU 4,368 20.6gc cr block busy 241,547 4,166 17 19.6 Clusterdb file sequential read 2,272,733 2,652 1 12.5 User I/Ogc current block 3-way 2,123,690 2,157 1 10.2 ClusterDisk file operations I/O 227,537 1,604 7 7.5 User I/O・Node4Top 5 Timed Foreground Events~~~~~~~~~~~~~~~~~~~~~~~~~~~~~ Avg wait % DBEvent Waits Time(s) (ms) time Wait Class------------------------------ ------------ ----------- ------ ------ ----------db file sequential read 5,651,562 6,052 1 21.9 User I/ODB CPU 5,315 19.2gc cr block busy 195,097 3,457 18 12.5 Clustergc cr grant 2-way 4,318,113 2,704 1 9.8 Clustergc current block 3-way 2,451,795 2,571 1 9.3 Cluster・Node5Top 5 Timed Foreground Events~~~~~~~~~~~~~~~~~~~~~~~~~~~~~ Avg wait % DBEvent Waits Time(s) (ms) time Wait Class------------------------------ ------------ ----------- ------ ------ ----------db file sequential read 5,631,340 6,850 1 20.7 User I/ODB CPU 5,586 16.9gc cr block busy 230,530 4,129 18 12.5 Clustergc current block 3-way 3,321,250 3,498 1 10.6 Clustergc cr grant 2-way 4,412,873 2,792 1 8.4 Cluster
看到这里,因为所有INSTANCE的待机EVENT都和I/O关联,基本上可以判断为是业务处理集中的问题。下面就需要仔细分析ASH数据,找到能证明结论的东西。
首先,我们看一下分钟单位的Active Session数。
◆SQL文SQL> select to_char(sample_time,'yyyy/mm/dd hh24:mi'),count(*)from m_dba_hist_active_sess_historywhere instance_number=<&instance_number>group by to_char(sample_time,'yyyy/mm/dd hh24:mi')order by to_char(sample_time,'yyyy/mm/dd hh24:mi');
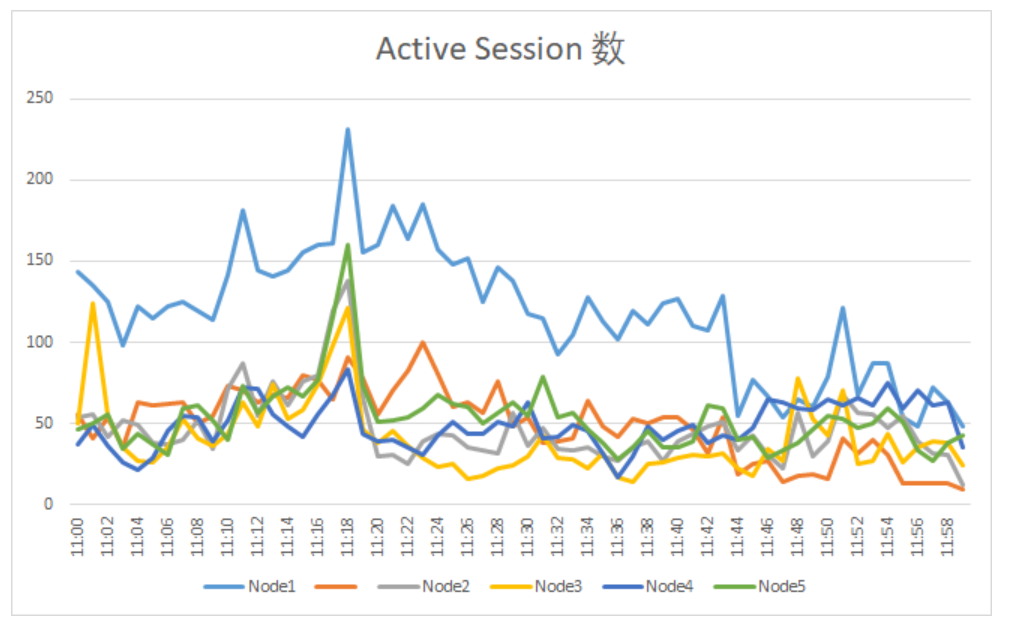
通过上面曲线图,我们可以清晰的看到在11:18 ,所有INSTANCE的Active Session数都有不同程度的增加。
然后,针对增长程度最大的Node1进行进一步的分析。先来看看Active Session的 PROGRAM分布情况。经过简单的分析,我们可以知道通过 sqlplus 和 JDBC Thin Client 连上来的SESSION数量最大,并且增长幅度最大。
SQL> select to_char(sample_time,'yyyy/mm/dd hh24:mi'),count(*)from m_dba_hist_active_sess_historywhere instance_number=1and PROGRAM like 'sqlplus%'group by to_char(sample_time,'yyyy/mm/dd hh24:mi')having count(*)>10order by to_char(sample_time,'yyyy/mm/dd hh24:mi');TO_CHAR(SAMPLE_TIME,'YYYY/MM/DDHH24:MI') COUNT(*)------------------------------------------------ ----------。。。。。。2021/03/22 11:14 122021/03/22 11:15 122021/03/22 11:16 122021/03/22 11:17 122021/03/22 11:18 24 ★SESSION数增加1倍2021/03/22 11:19 222021/03/22 11:20 262021/03/22 11:21 192021/03/22 11:22 162021/03/22 11:23 182021/03/22 11:24 172021/03/22 11:25 182021/03/22 11:26 182021/03/22 11:27 202021/03/22 11:28 222021/03/22 11:29 212021/03/22 11:30 23。。。。。。SQL> select to_char(sample_time,'yyyy/mm/dd hh24:mi'),count(*)2 from m_dba_hist_active_sess_history3 where instance_number=14 and PROGRAM like 'JDBC Thin Client'5 group by to_char(sample_time,'yyyy/mm/dd hh24:mi')having count(*)>10order by to_char(sample_time,'yyyy/mm/dd hh24:mi'); 6 7TO_CHAR(SAMPLE_TIME,'YYYY/MM/DDHH24:MI') COUNT(*)------------------------------------------------ ---------- 。。。。。。2021/03/22 11:13 992021/03/22 11:14 1042021/03/22 11:15 1162021/03/22 11:16 1182021/03/22 11:17 1192021/03/22 11:18 168 ★会话增加2021/03/22 11:19 1002021/03/22 11:20 1002021/03/22 11:21 1372021/03/22 11:22 1212021/03/22 11:23 1342021/03/22 11:24 1132021/03/22 11:25 1082021/03/22 11:26 1192021/03/22 11:27 892021/03/22 11:28 1072021/03/22 11:29 100 。。。。。。
到现在为止,基本上可以判定为11:18左右,通过 sqlplus 和 JDBC Thin Client 连上来的SESSION数过于集中,
引起了I/O处理过多,导致了这次问题的发生。
那这种问题应该如何处理呢?
有下面两个方向:
1. 分散业务处理。2. 找到I/O多的具体处理,看看有没有I/O少的方法。
第2个方向涉及SQL TUNING 的知识,这里不再细说了。
后续文章更加精彩,欢迎关注本公众号或访问【阅读原文】。
——End——
专注于技术不限于技术!
用碎片化的时间,一点一滴地提高数据库技术和个人能力。
欢迎关注!
数据库基础系列(从基础了解数据库):
通过寄存服务来“理解”Oracle数据库基本体系结构和动作流程
手把手系列(帮助个人技术成长):
数据库性能调优(性能调查方法):
等待事件(性能分析基础)
