


一、通用监控系统基础知识以及Prometheus的概述
1.监控系统的发展史:
SNMP时代:机器内置的SNMP
当今时代:ZABBIX、Prometheus…小米自研监控系统等。
未来的监控时代:AI…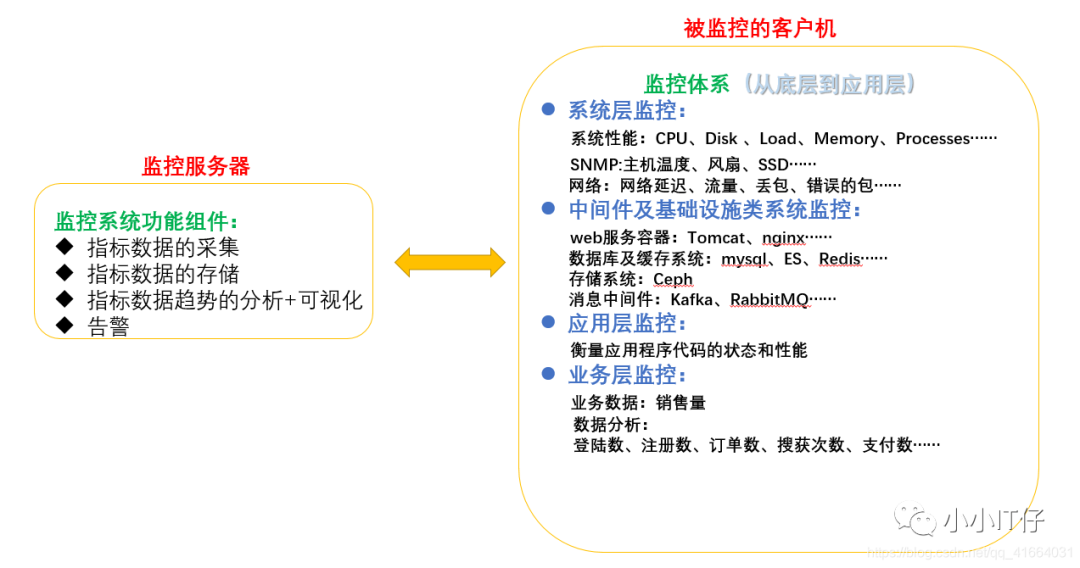

2.什么是Prometheus?
Prometheus是一款时序数据库,功能并非只作为数据库,是一款对目标(Target)进行监控的关键组件。结合其他的组件(Pushgateway、Altermanager、Grafana)组成一款完整的IT监控系统。默认数据保留一个月。
时序数据:在一段时间内通过重复的测量获得的值的集合,用图形表示会有一个数据轴和一个时间轴。
二、工作原理及适用性
1.prometheus获取数据的方式
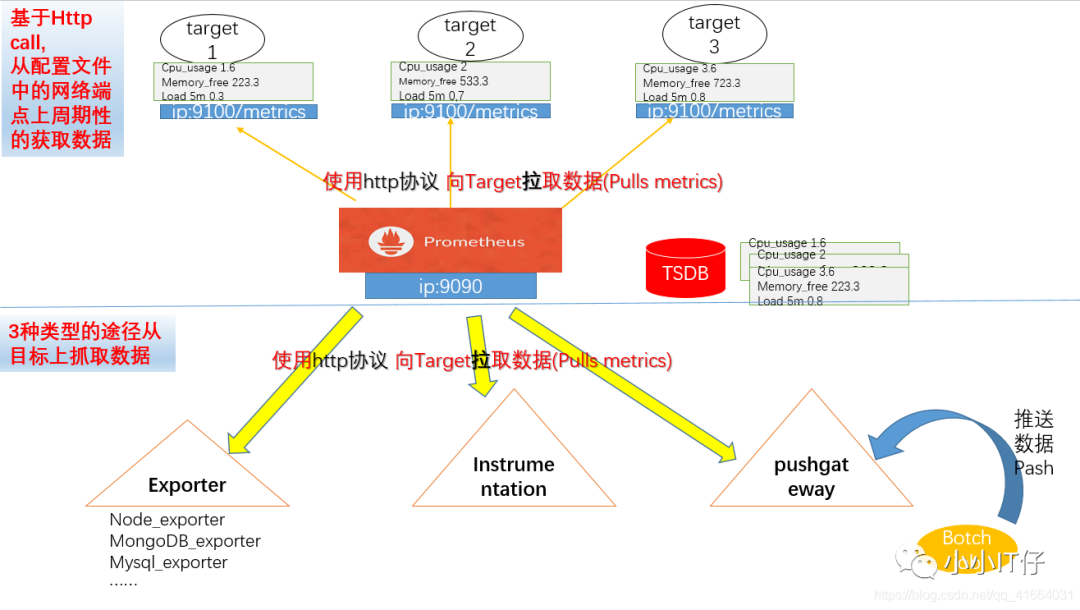
基于Http call,从配置文件中指定的网络端点上周期性的获取数据。
支持三种类型的途径从目标上拉取数据。(被监控的对象需要安装什么?)
Exporters :官网https://prometheus.io/download/#node_exporter
Instrumentation :应用程序内置prometheus兼容的指标格式数据
Pushgateway:先推送给中间器,在从中间器拉取
2.Prometheus 负责时序型指标数据的采集及存储,数据的分析、聚合、可视化、告警需要安装其他组件。

3.Prometheus数据模型
使用“键值”的形式存储时序的聚合数据,不支持存储文本信息
memory_free{ip="10.100.1.2"} 6238键 标签(作为过滤器) 值
4.指标类型
count:计数器
Gauge:仪表盘
Histogram:直方图
summary:摘要
5.作业(Job)和实例(Instance)
实例instance:每个网络端点叫一个实例
作业Job:有相同功能的实例的集合称为一个Job.
*一般获取数据的途径相同(安装了相同exporter)的实例(网络端点)合并到一个Job内 *
6.PromQL
prometheus 提供了内置的数据查询语言,用户可以实时进行数据的查询及聚合。
支持两种向量的查询,内置了用于数据处理的函数
即时向量:最近的一次时间戳的数据
时间范围向量:查询一段时间段内的数据指标
7.Alter
抓取一场数据后,prometheus支持通过“告警”机制向用户发送反馈或警示。
Prometheus只支持负责生成告警提示,具体的告警行为由另外一个独立的程序
AlterManager负责
告警由Prometheus基于用户的告警规则周期性计算生成;
Altermanager接收到Prometheus的告警警示后基于用户自定义的告警路由向接收人发送告警消息。
三、Prometheus-Server 部署
1.Prometheus-server的部署,二进制包安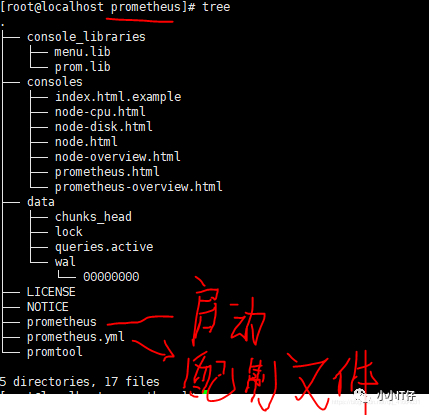
(1).准备二进制包,从官网prometheus.io下载对应系统版本的包,或者国内源https://mirrors.tuna.tsinghua.edu.cn/github-release/prometheus/(2).创建prometheus路径,用于存放二进制包、安装在此位置下、日志存放在此目录下,方便后期查找。(3).导入二进制包、解压在此目录下,并作软连接方便记忆。(4).默认安装以后会在前端运行。
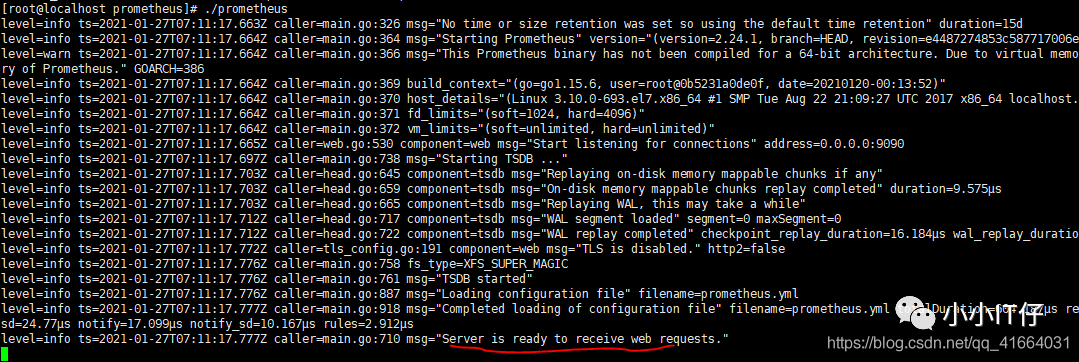
[root@localhost ~]# mkdir prometheus && chown -R root:root prometheus[root@localhost ~]# cd prometheus[root@localhost prometheus]# tar -zxvf prometheus-2.24.1.linux-386.tar.gz[root@localhost prometheus]# cd prometheus-2.24.1.linux-386/[root@localhost prometheus-2.24.1.linux-386]# cd ..[root@localhost prometheus]# ln -s prometheus-2.24.1.linux-386 prometheus[root@localhost prometheus]# lltotal 62100lrwxrwxrwx 1 root root 27 Jan 26 23:09 prometheu -> prometheus-2.24.1.linux-386drwxr-xr-x 4 3434 3434 132 Jan 19 18:10 prometheus-2.24.1.linux-386-rw-r--r-- 1 root root 63587661 Jan 22 04:23 prometheus-2.24.1.linux-386.tar.gz[root@localhost prometheus]# cd prometheus[root@localhost prometheus]# lltotal 145780drwxr-xr-x 2 3434 3434 38 Jan 19 18:08 console_librariesdrwxr-xr-x 2 3434 3434 173 Jan 19 18:08 consoles-rw-r--r-- 1 3434 3434 11357 Jan 19 18:08 LICENSE-rw-r--r-- 1 3434 3434 3420 Jan 19 18:08 NOTICE-rwxr-xr-x 1 3434 3434 79203846 Jan 19 16:16 prometheus-rw-r--r-- 1 3434 3434 926 Jan 19 18:08 prometheus.yml-rwxr-xr-x 1 3434 3434 70051362 Jan 19 16:18 promtool[root@localhost prometheus]# ./prometheus

(5).为了方便,我们需要把prometheus运行在后台,需要把服务添加到系统服务内。
创建prometheus的日志文件,用于保存日志信息;编写prometheus启动脚本,引用二进制包中的原始的启动脚本;将prometheus服务添加到service内,并设置开机自启。
[root@localhost prometheus]# touch prometheus.log &&chmod 755 prometheus.log[root@localhost prometheus]# vim peometheus.sh[root@localhost prometheus]# chmod 755 prometheus.sh[root@localhost prometheus]# vim usr/lib/systemd/system/prometheus.service[root@localhost prometheus]# systemctl start prometheus.service[root@localhost prometheus]# systemctl status prometheus.service[root@localhost prometheus]# systemctl status prometheus.service
启动脚本prometheus.sh
#!/bin/bash#引用的是二进制包内的原始的启动脚本和原始配置文件,所以文件的路劲要注意不要写错/prometheus/prometheus/prometheus --config.file=/prometheus/prometheus/prometheus.yml &>> prometheus/prometheus.logrometheus/prometheus.log
添加到service内prometheus.service,注意文件路径/usr/lib/systemd/system/
[Unit]Description=Prometheus[Service]User=rootGroup=rootType=simple#使用我们自定义的启动脚本,否则如果用原始的启动脚本将无法保存日志ExecStart=/prometheus/prometheus.sh[Install]WantedBy=multi-user.target
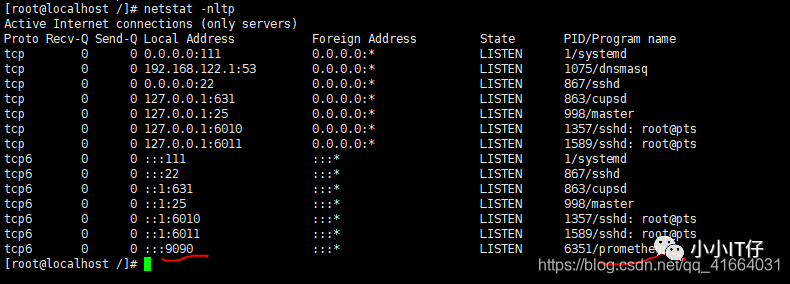
启动成功,web访问ip:9090
默认为9090端口
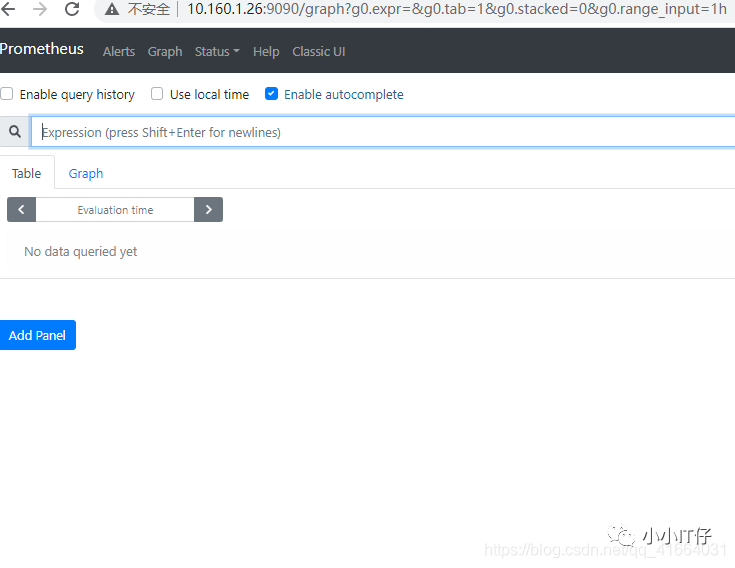
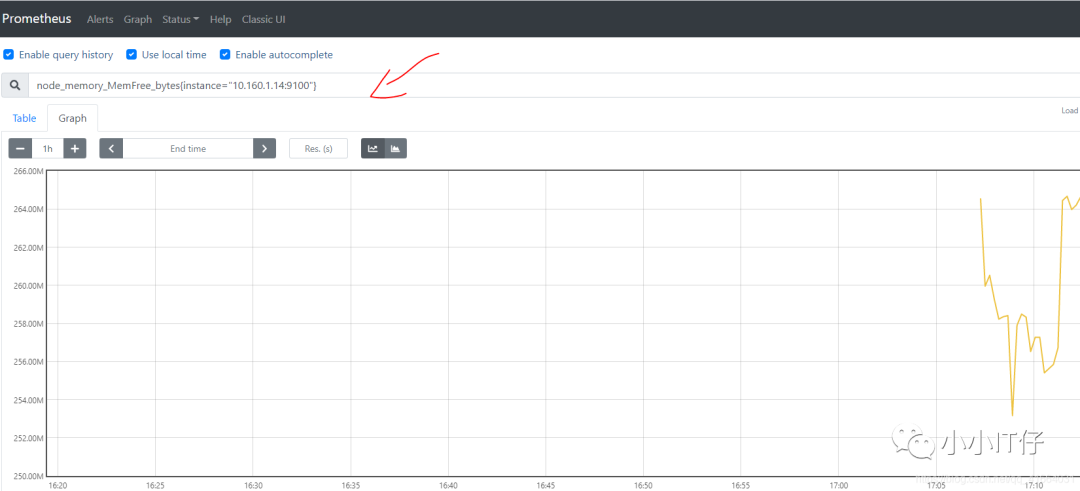
Prometheus web界面的简单使用,核心为查询公式PromQL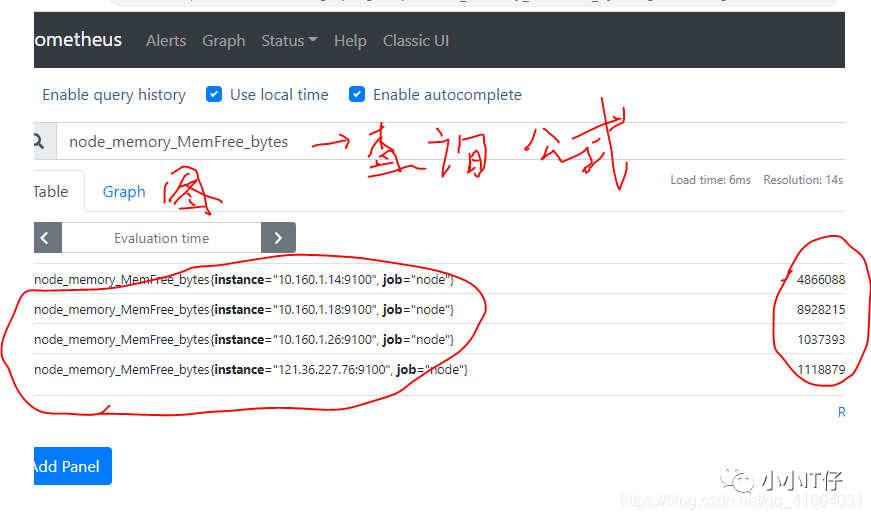
四、exporter的部署—>node_exporter为例,其他类型安装方式一致
【1】Node_exporter的部署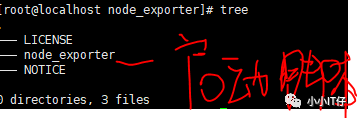
(1).准备二进制包,从官网prometheus.io下载对应系统版本的包
(2).创建exporter路径,用于存放二进制包、安装在此位置下方便后期查找。
(3).导入二进制包、解压在此目录下,并作软连接方便记忆。
(4).默认安装以后会在前端运行。
[root@localhost ]# mkdir exporter && chown -R root:root exporter/*[root@localhost ]# cd exporter/[root@localhost exporter]# rz[root@localhost exporter]# ll[root@localhost exporter]# tar -zxvf node_exporter-1.0.1.linux-amd64.tar.gz[root@localhost exporter]# ln -s node_exporter-1.0.1.linux-amd64 node_exporter[root@localhost exporter]# cd node_export[root@localhost node_export]# ./node_exporter

(5).将prometheus服务添加到service内,并设置开机自启。
[root@localhost node_export]# vim usr/lib/systemd/system/node_export.service[root@localhost node_export]# systemctl daemon-reload[root@localhost node_export]# systemctl start node_export.service[root@localhost node_export]# systemctl enanle node_export.service[root@localhost node_export]# systemctl status node_export.service

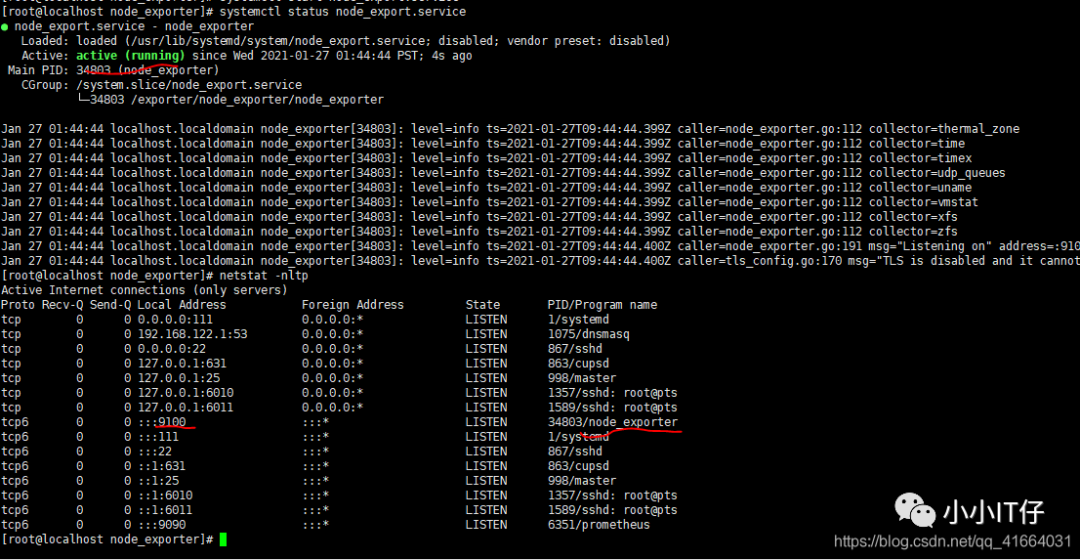
web 访问:ip:9100/metrics

【2】监控Mysql、Tomcat、Nginx
(1).准备二进制包mysqld_exporter,从官网prometheus.io下载对应系统版本的包
(2).创建mysqld_exporter路径,用于存放二进制包、安装在此位置下方便后期查找。
(3).导入二进制包、解压在此目录下,并作软连接方便记忆,并创建在同目录下作为启动脚本的指定配置文件my.cnf。
(4).默认安装以后会在前端运行。
(5).将mysqld_exporter添加为服务在后台运行
[root@localhost ~]# mkdir mysqld_exporter && chown -R root:root mysqld_exporter[root@localhost ~]# cd mysqld_exporter/[root@localhost mysqld_exporter]# rz[root@localhost mysqld_exporter]# tar -zxvf mysqld_exporter-0.12.1.linux-386.tar.gz[root@localhost mysqld_exporter]# ln -s mysqld_exporter-0.12.1.linux-386 mysqld_exporter[root@localhost mysqld_exporter]# vim my.cnf[client]host=127.0.0.1user=exporterpassword=passwd1!#与mysql权限配置一致,用户名 密码如下配置[root@localhost mysqld_exporter]# mysqlgrant all privileges on *.* to 'exporter'@'127.0.0.1' identified by 'passwd1!';[root@localhost mysqld_exporter]# vim usr/lib/systemd/system/mysqld_exporter.service
mysqld_exporter.service内容示例
root@localhost mysqld_exporter]# vim usr/lib/systemd/system/mysqld_exporter.service[Unit]Description=mysqld_exporterAfter=network.target[Service]Type=simpleUser=rootExecStart=/mysqld_exporter/mysqld_exporter/mysqld_exporter --config.my-cnf=/mysqld_exporter/mysqld_exporter/my.cnf \--collect.slave_status \--collect.slave_hosts \--log.level=error \--collect.info_schema.processlist \--collect.info_schema.innodb_metrics \--collect.info_schema.innodb_tablespaces \--collect.info_schema.innodb_cmp \--collect.info_schema.innodb_cmpmemRestart=on-failure[Install]WantedBy=multi-user.targe
五.PromQL查询语句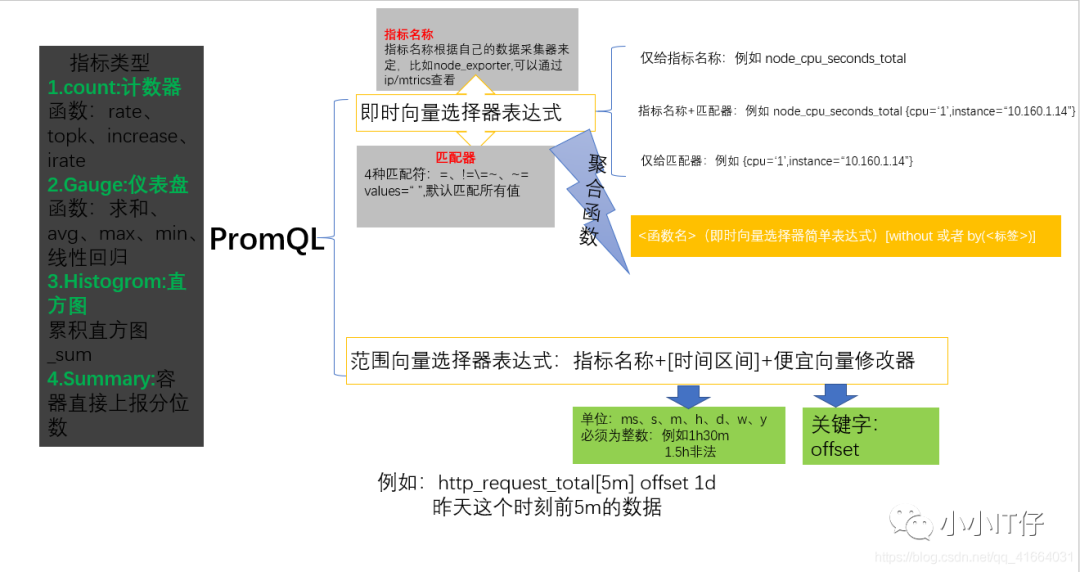
11个聚合函数:
逻辑运算符:and or unless(除了)
六、服务发现机制、重新打标-配置prometheus的启动配置文件
【服务发现】
1.静态配置,启动配置文件---->>prometheus.yml
2.基于文件发现服务,prometheus_files_sd.yml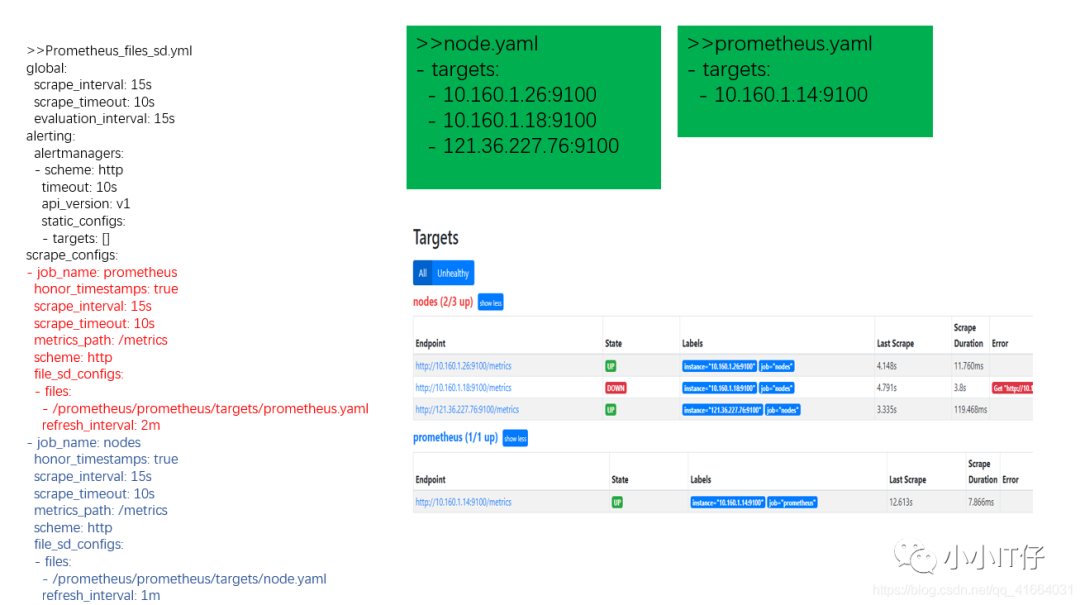
3.DNS发现。
DNS_SRV记录
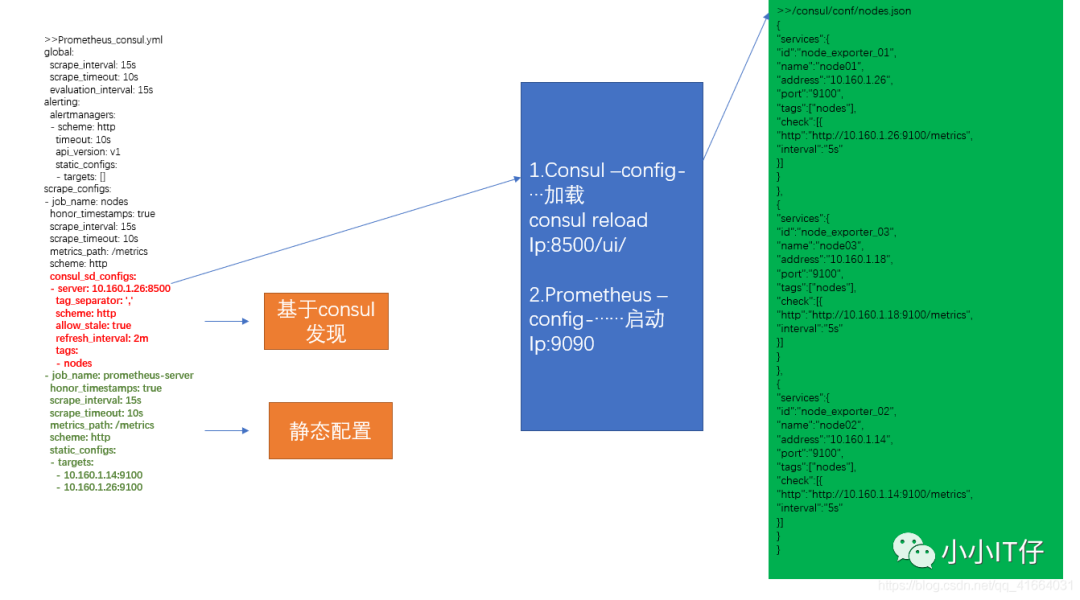
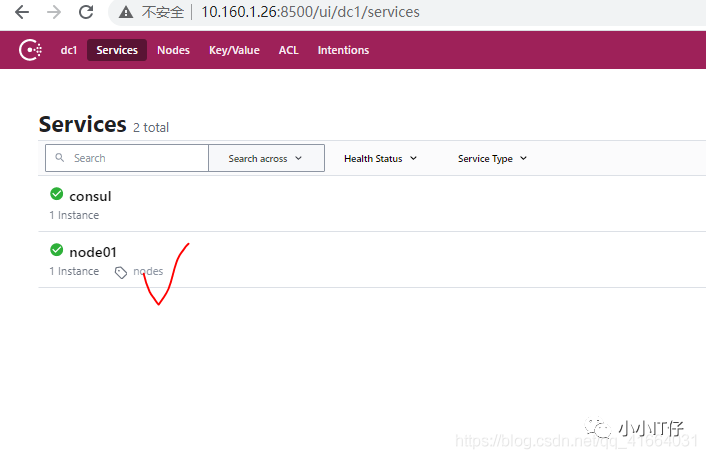
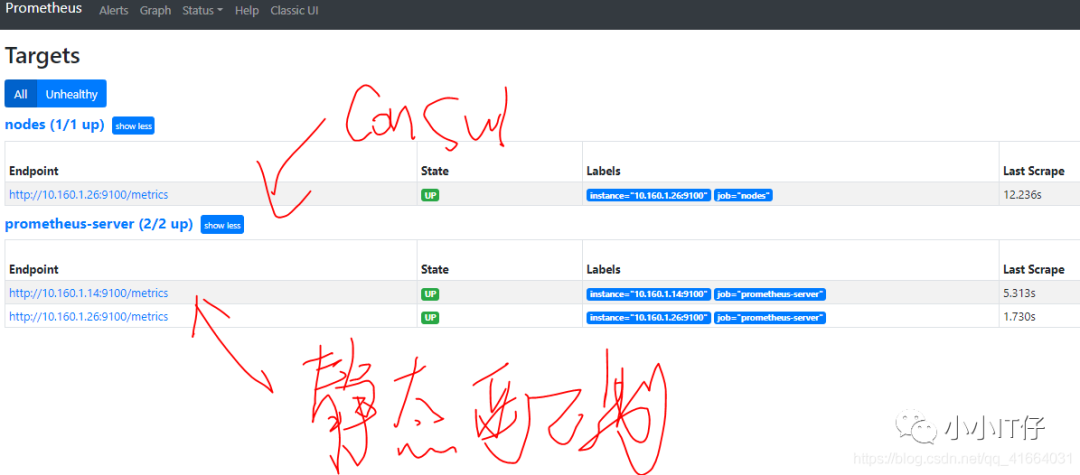
4.Consul发现服务(consul+prometheus同时工作)
准备目录
(1) .下载地址:https://www.consul.io/downloads/(2) .安装unzip consul_1.9.2_linux_amd64.zip -d /consul_path(3) .开发者模式./consul agent -dev -ui -data-dir=/consul/data/ -config-dir=/consul/conf -client=0.0.0.0(4) .使用
5.基于Kubernetes API动态发现服务及指标抓取的生命周期
【2】重新打标,相当于zabbix更改监控项,修改prometheus的配置
对于发现的每个目标,prometheus会默认执行操作。
relabel_config重新打标:
替换:replace、 hoshmod
删除:keep 、drop
创建:labelmap、labeldrop、labelkeep
source_labels:使用原始标签
正则表达式:
示例:重新打标label
重新打标之前: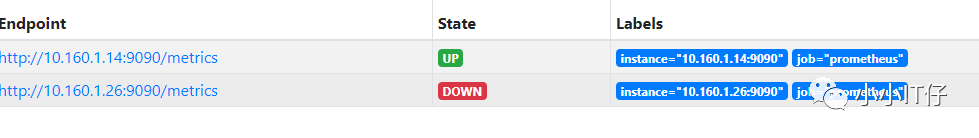 重新打标以后:
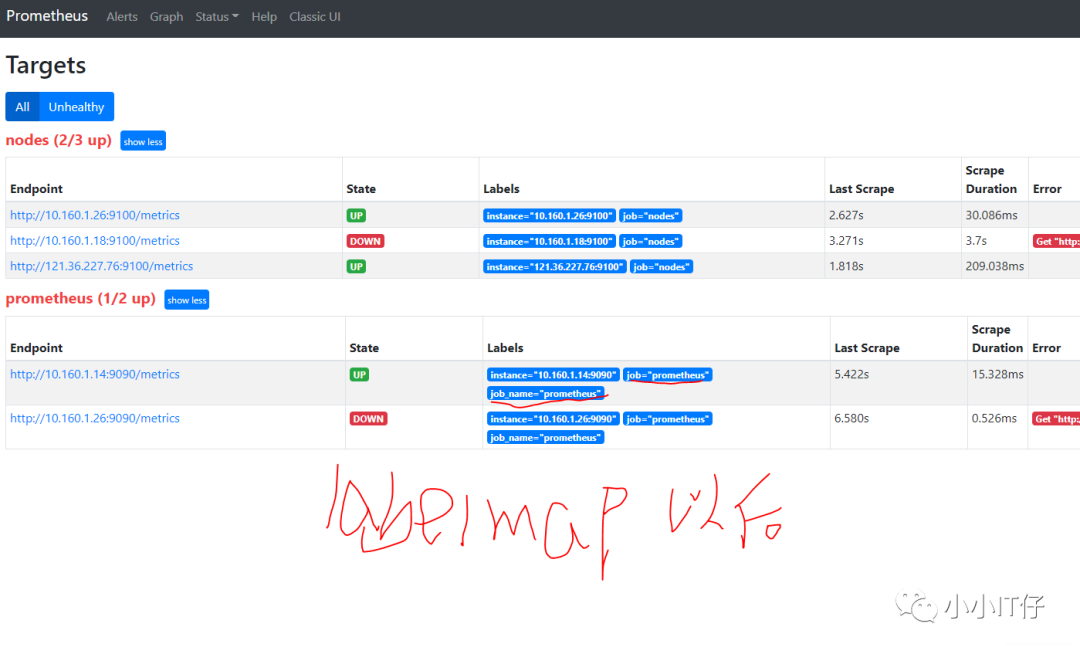
七、Grafana可视化展示-查询持久化
安装Grafana、添加prometheus数据源
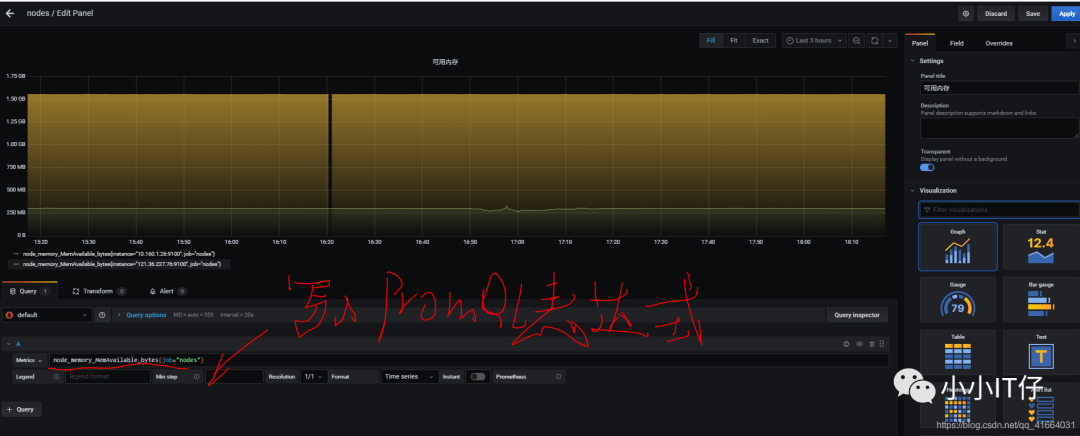
简单图形:
如果自己太烧脑,也可以使用Grafana提供的模板。复制ID 导入即可,模板是在线的。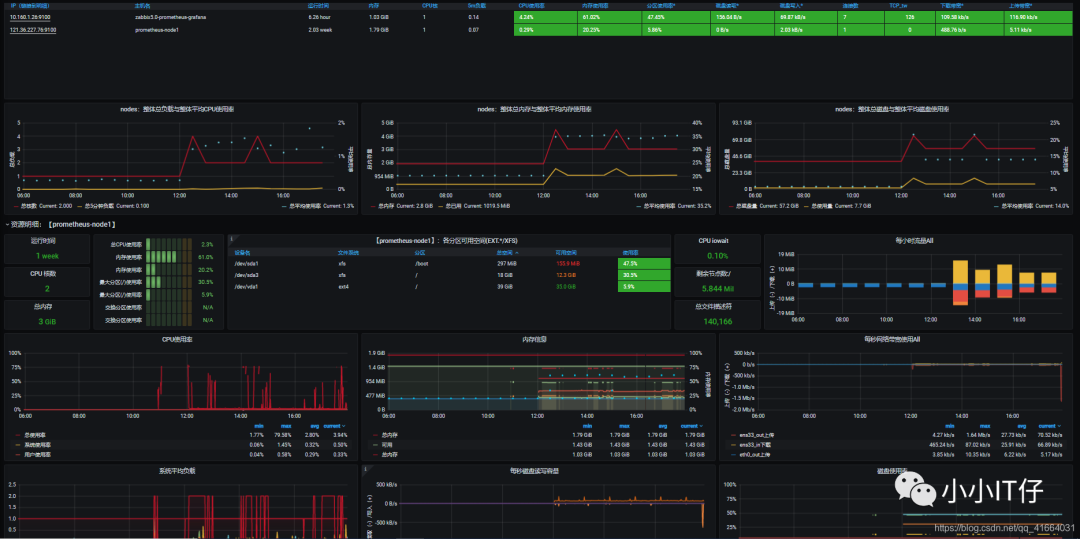
所以,关键还是PromQL表达式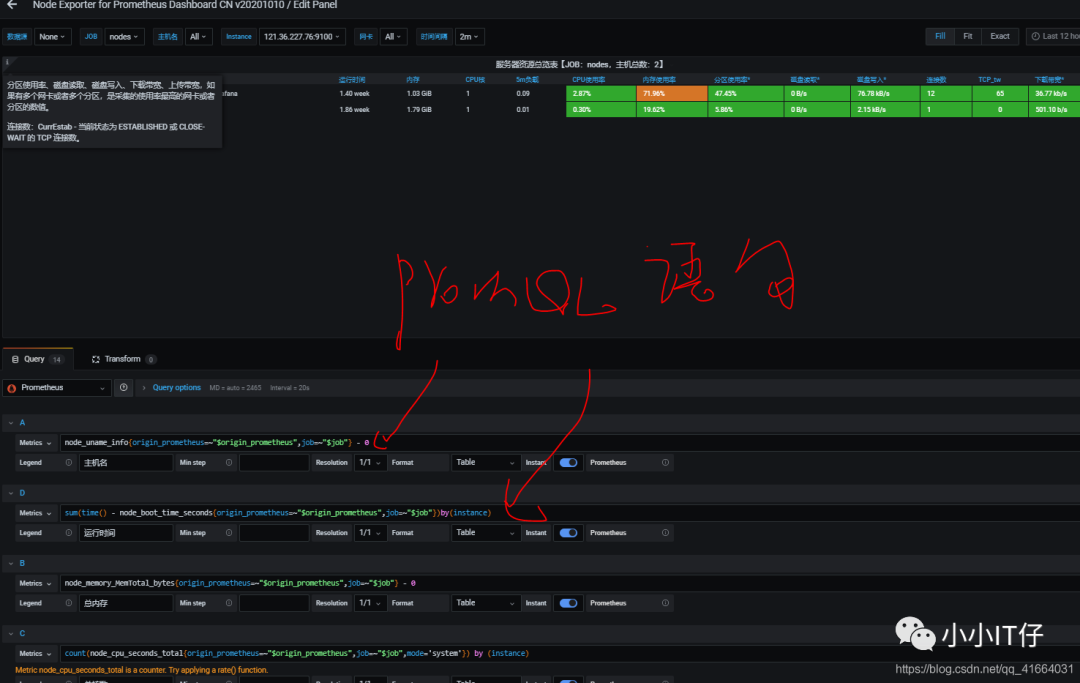
八、部署AlterManager,配置告警
本次实验基于文件发现targets,静态配置Alertmanager,创建告警规则up.ymal,当node_exporter类型告警时发送给qq邮箱,当prometheus-server告警发送给企业微信
省略企业微信内部创建应用的过程
【1】部署,加载告警规则
安装
[root@localhost ~]# mkdir /alertmanager #创建目录[root@localhost ~]# cd /alertmanager/[root@localhost alertmanager]# rz[root@localhost alertmanager]# tar -zxvf alertmanager-0.21.0.linux-amd64.tar.gz #解压[root@localhost alertmanager]# ln -s alertmanager-0.21.0.linux-amd64 alertmanager 软连接[root@localhost alertmanager]# cd alertmanager[root@localhost alertmanager]# ll#添加为服务[root@localhost alertmanager]# vim /usr/lib/systemd/system/alertmanager.service[Unit]Description=alertmanager[Service]User=rootGroup=rootType=simple#使用原始的启动脚本ExecStart=/alertmanager/alertmanager/alertmanager --config.file=/alertmanager/alertmanager/alertmanager.yml[Install]WantedBy=multi-user.target[root@localhost alertmanager]# systemctl daemon-reload[root@localhost alertmanager]# systemctl start alertmanager.servicetcp6 0 0 :::9093 :::* LISTEN 51218/alertmanagertcp6 0 0 :::9094 :::* ISTEN 51218/alertmanager ```
2.修改alertmanager.yml根据自己的实际需要,比如告警方式(email、wechat…)
3.修改prometheus_files_sd.yml,
3.1将alertmanager 作为一个被监控的target,所以在/targets/下创建alertmanager.yaml
3.2配置告警器
3.3 添加告警规则
3.4 在/rules/下编写告警规则

基于文件发现/…yaml
告警规则/rules/up.yaml,被用于prometheus的配置文件中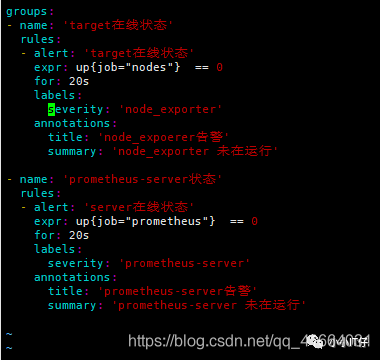
启动prometheus,alertmanager
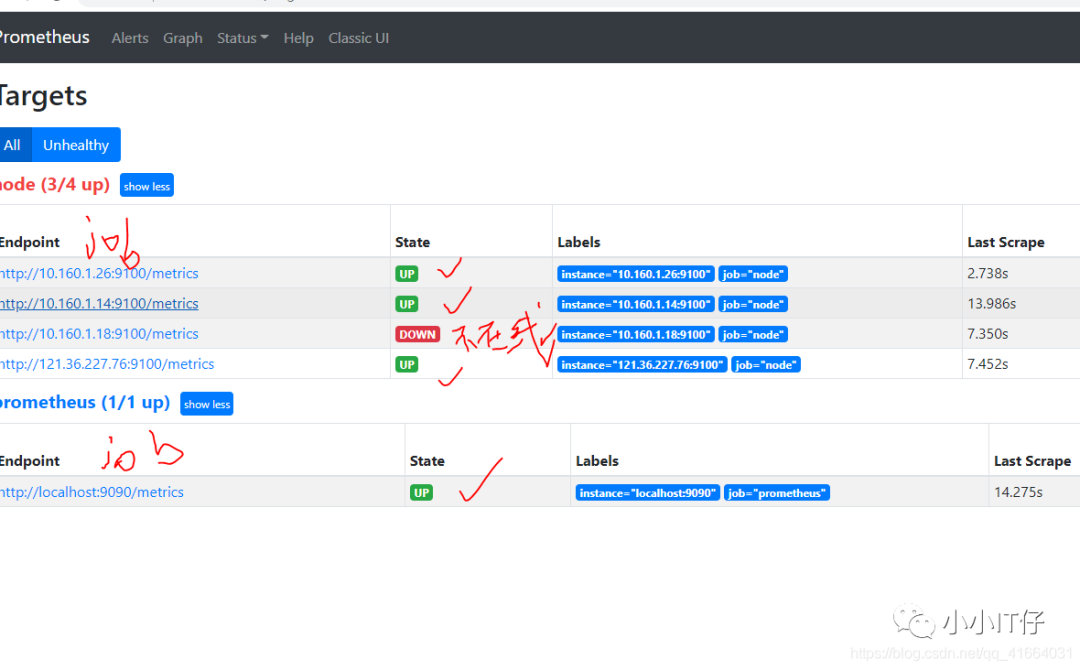
查看web:
ip:9090
ip:9093
关闭一个node_exporter和一个prometheus-server,看web界面的变化和告警消息的接收情况
1.实验前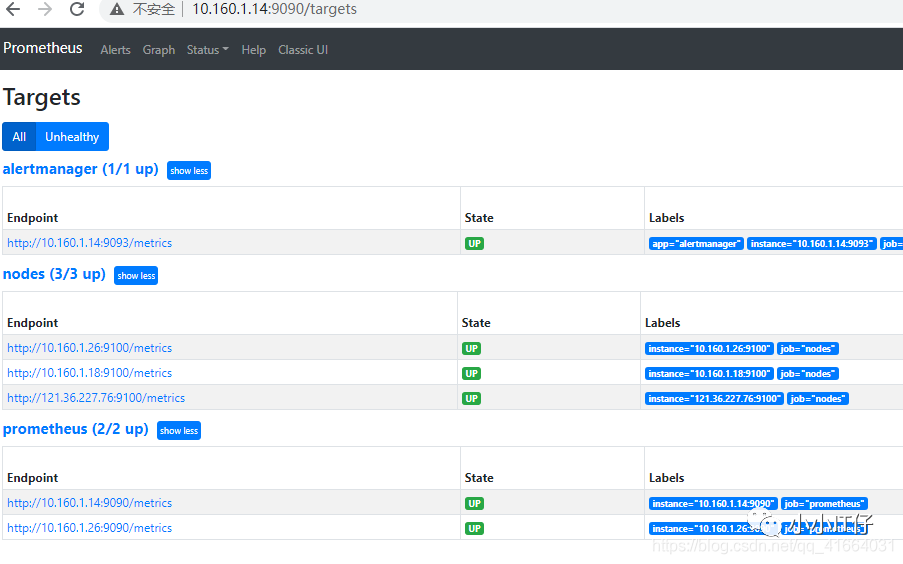 2.关闭target
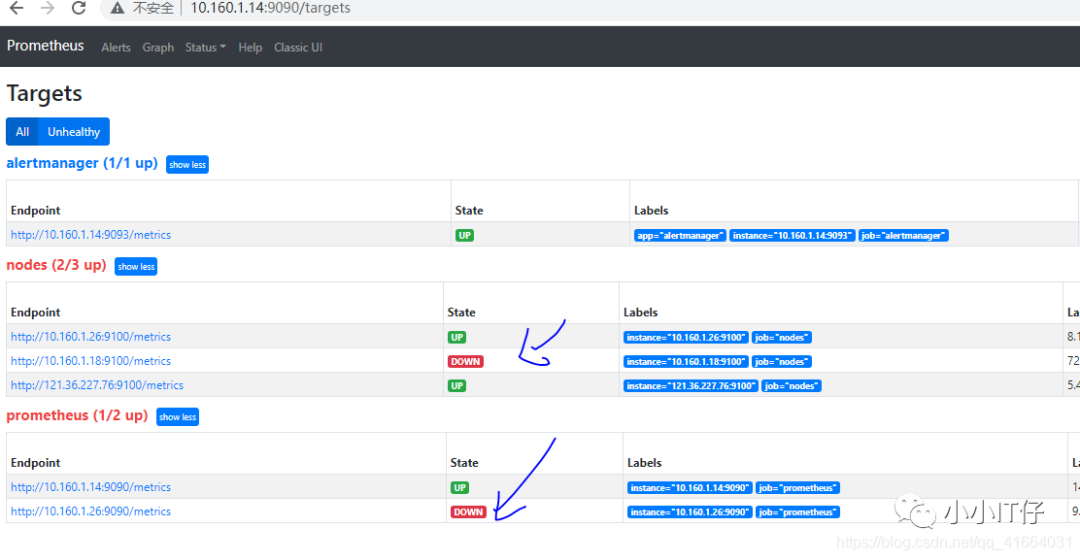
3.看变化
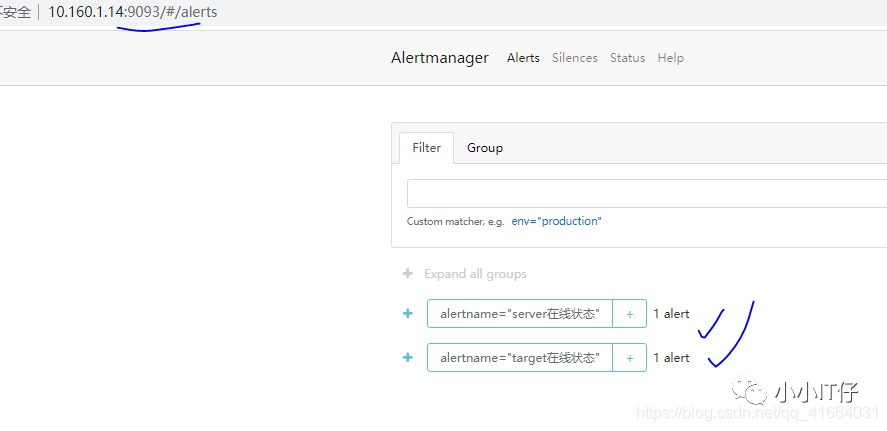
4.收到告警信息,邮件和企业微信分别发送不同等级的告警


结束!
附:所有配置文件信息

prometheus_files_sd.yml
global:scrape_interval: 15sscrape_timeout: 10sevaluation_interval: 15s#静态配置告警alerting:alertmanagers:- scheme: httptimeout: 10sapi_version: v1static_configs:- targets:- 10.160.1.14:9093#动态配置告警#alerting:# alertmanagers:# - scheme: http# timeout: 10s# api_version: v1# file_sd_configs:# - files:# - /prometheus/prometheus/targets/alertmananger.yaml#告警规则rule_files:- "/prometheus/prometheus/rules/*.yaml"- "/prometheus/prometheus/alert_rules/*.yaml"#targetsscrape_configs:- job_name: prometheushonor_timestamps: truescrape_interval: 15sscrape_timeout: 10smetrics_path: /metricsscheme: httpfile_sd_configs:- files:- /prometheus/prometheus/targets/prometheus.yamlrefresh_interval: 2m# relabel_configs:# - regex: "(job|app)"# replacement: ${1}_name# action: labelmap- job_name: nodeshonor_timestamps: truescrape_interval: 15sscrape_timeout: 10smetrics_path: /metricsscheme: httpfile_sd_configs:- files:- /prometheus/prometheus/targets/node.yamlrefresh_interval: 1m- job_name: alertmanagerhonor_timestamps: truescrape_interval: 15sscrape_timeout: 10smetrics_path: /metricsscheme: httpfile_sd_configs:- files:- /prometheus/prometheus/targets/alertmanager.yaml
2.alertmanager.yaml
# 全局配置项global:resolve_timeout: 5m #超时,默认5min#邮箱smtp服务smtp_smarthost: 'smtp.qq.com:465'smtp_from: '2925006354@qq.com'smtp_auth_username: '2925006354@qq.com'smtp_auth_password: 'bzb'smtp_require_tls: falsewechat_api_url: "https://qyapi.weixin.qq.com/cgi-bin/"wechat_api_corp_id: "227"wechat_api_secret: "tcWH82XHF_gE"# 模板templates:- '/alertmanager/alertmanager/tmpl/*.tmpl'# 路由route:group_by: ['alertname'] # 报警分组依据group_wait: 20s #组等待时间group_interval: 20s # 发送前等待时间repeat_interval: 1h #重复周期receiver: 'email' # 默认警报接收者#子路由routes:- receiver: 'wechat'match:severity: prometheus-server #标签severity为test时满足条件,使用wechat警报- receiver: 'email'match:severity: node_exporter# 警报接收者receivers:- name: 'email' #警报方式email_configs:- to: '2925006354@qq.com' # 接收警报的emailhtml: '{{ template "emai.html" . }}' # 模板headers: { Subject: " {{ .CommonLabels.instance }} {{ .CommonAnnotations.title }}" } #标题- name: 'wechat' #警报方式wechat_configs:- send_resolved: trueto_party: '2' #接收部门idagent_id: '1000006' #应用IDto_user: ''to_tag: ''message: '{{ template "wechat.html" . }}'
3.alertmanager.yaml
- targets:- 10.160.1.14:9093labels:app: alertmanager
4.node.yaml
- targets:- 10.160.1.26:9100- 10.160.1.18:9100- 121.36.227.76:9100
5.告警规则 up.yaml
groups:- name: 'target在线状态'rules:- alert: 'target在线状态'expr: up{job="nodes"} == 0for: 20slabels:severity: 'node_exporter'annotations:title: 'node_expoerer告警'summary: 'node_exporter 未在运行'- name: 'prometheus-server状态'rules:- alert: 'server在线状态'expr: up{job="prometheus"} == 0for: 20slabels:severity: 'prometheus-server'annotations:title: 'prometheus-server告警'summary: 'prometheus-server 未在运行'
6.consul.json
{"services":[{"id": "node_exporter_01","name": "node01","address": "121.36.227.76","port": 9100,"tags": ["nodes"],"check":[{"http": "http://112.36.227.76:9100/metrics","interval": "5s"}]},{"id": "node_exporter_02","name": "node02","address": "10.160.1.18","port": 9100,"tags": ["nodes"],"check":[{"http": "http://10.160.1.18:9100/metrics","interval": "5s"}]}]}
7.emil.tmpl
{{ define "emai.html" }}{{- if gt (len .Alerts.Firing) 0 -}}{{ range .Alerts }}@告警信息:<pre>告警级别: {{ .Labels.severity }} 级<br>告警类型: {{ .Labels.alertname }}<br>故障实例: {{ .Labels.instance }}<br>告警主题: {{ .Annotations.summary }}<br>⏱ : {{ (.StartsAt.Add 28800e9).Format "2006-01-02 15:04:05" }} <br></pre>{{ end }}{{ end -}}{{- if gt (len .Alerts.Resolved) 0 -}}{{ range .Alerts }}@告警已恢复<pre>告警级别: {{ .Labels.severity }} 级<br>告警类型: {{ .Labels.alertname }}<br>恢复实例: {{ .Labels.instance }}<br>恢复主题: {{ .Annotations.summary }}<br>⏱ : {{ (.StartsAt.Add 28800e9).Format "2006-01-02 15:04:05" }}<br>恢复时间:{{ .EndsAt.Format "2006-01-02 15:04:05" }} <br></pre>{{ end }}{{ end -}}{{- end }}
8.wechat.tmpl
{{ define "wechat.html" }}{{- if gt (len .Alerts.Firing) 0 -}}{{ range .Alerts }}@告警信息:告警级别: {{ .Labels.severity }} 级告警类型: {{ .Labels.alertname }}故障实例: {{ .Labels.instance }}告警主题: {{ .Annotations.summary }}⏱ : {{ (.StartsAt.Add 28800e9).Format "2006-01-02 15:04:05" }}{{ end }}{{ end -}}{{- if gt (len .Alerts.Resolved) 0 -}}{{ range .Alerts }}@告警已恢复告警级别: {{ .Labels.severity }} 级告警类型: {{ .Labels.alertname }}恢复实例: {{ .Labels.instance }}恢复主题: {{ .Annotations.summary }}⏱ : {{ (.StartsAt.Add 28800e9).Format "2006-01-02 15:04:05" }}恢复时间:{{ .EndsAt.Format "2006-01-02 15:04:05" }}{{ end }}{{ end -}}{{- end }}
