Prometheus 是什么? Prometheus是一套开源的监控&报警&时间序列数据库的组合,起始是由SoundCloud公司开发的。随着发展,越来越多公司和组织接受采用Prometheus,社区也十分活跃,他们便将它独立成开源项目,并且有公司来运作。google SRE的书内也曾提到跟他们BorgMon监控系统相似的实现是Prometheus。现在最常见的Kubernetes容器管理系统中,通常会搭配Prometheus进行监控。类似的产品还有influxdb, 如果用于监控用途是通常会配合grafana进行数据展示和报警。
Prometheus 的优点 Prometheus 的特性 更详细的说明和帮助,可以参考prometheus官网:https://prometheus.io/
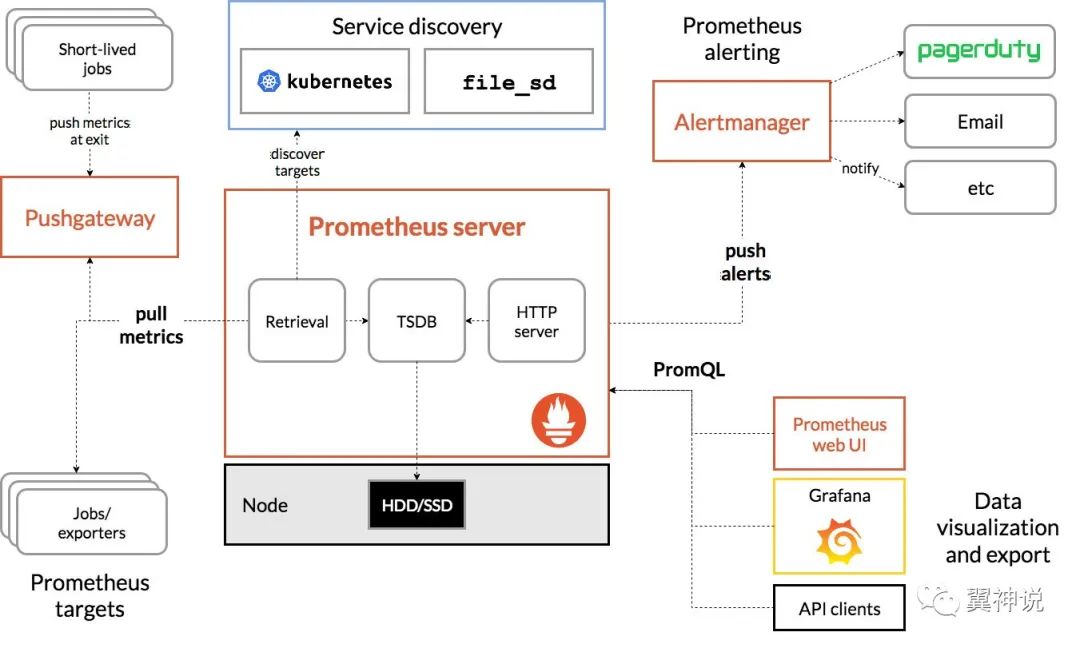
Prometheus的架构
Prometheus使用的场景 如官网描述的一样,prometheus主要是在当我们需要单纯记录以时间进行分片的数据时使用,无论是系统级别的监控,或是我们的高度动态的服务架构。针对微服务场景,prometheus也能很好的支持多为数据的收集和查询。
当然,prometheus也有局限性,如果我们的监控或系统,需要百分百的准确性就不太适合。
需要了解更多关于prometheus的知识,强烈建议好好阅读官网的文档。
Prometheus的安装 本文的重点是如何在CentOS 7中安装和配置Prometheus,我们要按生产级的要求来部署Prometheus。以下就开始我们的部署工作, 按步骤进行操作。
基础准备 以root或具有sudo权限的用户登录CentOS系统,执行以下命令升级系统(非必要):
禁用SELinux 1 vim etc/sysconfig/selinux
将SELINUX=enforcingELINUX=disabledreboot
同步时区( 设置系统时区为上海) 1 ln -s usr/share/zoneinfo/Asia/Shanghai etc/localtime
下载安装包 1 2 3 cd data/software/ wget https://github.com/prometheus/prometheus/releases/download/v2.11.1/prometheus-2.11.1.linux-amd64.tar.gz tar -zxvf prometheus-2.11.1.linux-amd64.tar.gz
创建执行用户 1 useradd --no-create-home --shell bin/false prometheus
创建执行目录 1 2 mkdir etc/prometheus mkdir var/lib/prometheus
修改目录权限(更改所有者) 1 2 chown prometheus:prometheus etc/prometheus chown prometheus:prometheus var/lib/prometheus
复制文件到执行目录 1 2 3 4 5 6 7 8 9 10 11 12 cd data/software/prometheus-2.11.1.linux-amd64 cp prometheus usr/local/bin/ cp promtool usr/local/bin/ # 设置权限(更改所有者) chown prometheus:prometheus usr/local/bin/prometheus chown prometheus:prometheus usr/local/bin/promtool cp -r consoles etc/prometheus cp -r console_libraries etc/prometheus chown -R prometheus:prometheus etc/prometheus/consoles chown -R prometheus:prometheus etc/prometheus/console_libraries
添加配置文件 1 2 3 mkdir etc/prometheus/ cp prometheus.xml etc/prometheus/ or vim etc/systemd/system/prometheus.service chown prometheus:prometheus etc/prometheus/prometheus.yml
当然,如果没有模板文件的话,也可以新创建一个,具体配置如下:
1 2 3 4 5 6 7 8 9 10 11 12 13 14 15 16 17 18 19 20 21 22 23 24 25 26 27 28 29 # my global config global: scrape_interval: 15s # Set the scrape interval to every 15 seconds. Default is every 1 minute. evaluation_interval: 15s # Evaluate rules every 15 seconds. The default is every 1 minute. # scrape_timeout is set to the global default (10s). # Alertmanager configuration alerting: alertmanagers: - static_configs: - targets: # - alertmanager:9093 # Load rules once and periodically evaluate them according to the global 'evaluation_interval'. rule_files: # - "first_rules.yml" # - "second_rules.yml" # A scrape configuration containing exactly one endpoint to scrape: # Here it's Prometheus itself. scrape_configs: # The job name is added as a label `job=<job_name>` to any timeseries scraped from this config. - job_name: 'prometheus' # metrics_path defaults to '/metrics' # scheme defaults to 'http'. static_configs: - targets: ['localhost:9090']
创建服务 1 vi etc/systemd/system/prometheus.service
1 2 3 4 5 6 7 8 9 10 11 12 13 14 15 16 17 [Unit] Description=Prometheus Wants=network-online.target After=network-online.target [Service] User=prometheus Group=prometheus Type=simple ExecStart=/usr/local/bin/prometheus \ --config.file etc/prometheus/prometheus.yml \ --storage.tsdb.path var/lib/prometheus/ \ --web.console.templates=/etc/prometheus/consoles \ --web.console.libraries=/etc/prometheus/console_libraries [Install] WantedBy=multi-user.target
启动服务 1 2 3 4 5 6 # reload服务配置systemctl daemon-reload # 启动服务systemctl start prometheus # 查看服务状态systemctl status prometheus
如果一切正常应该可以看到如下输出, 说明服务以及正常启动。
1 2 3 4 5 6 7 8 9 10 11 12 13 14 15 16 17 18 19 [root@ ~]# systemctl status prometheus ● prometheus.service - Prometheus Loaded: loaded (/etc/systemd/system/prometheus.service; enabled; vendor prese t: disabled) Active: active (running) since Mon 2019-07-15 17:43:53 CST; 1h 34min ago Main PID: 22807 (prometheus) CGroup: system.slice/prometheus.service └─22807 usr/local/bin/prometheus --config.file etc/prometheus/pr... Jul 15 17:43:53 . prometheus[22807]: level=info ts=2019-07-15T09:43:53.660Z...)" Jul 15 17:43:53 . prometheus[22807]: level=info ts=2019-07-15T09:43:53.660Z...)" Jul 15 17:43:53 . prometheus[22807]: level=info ts=2019-07-15T09:43:53.661Z...)" Jul 15 17:43:53 . prometheus[22807]: level=info ts=2019-07-15T09:43:53.663Z...." Jul 15 17:43:53 . prometheus[22807]: level=info ts=2019-07-15T09:43:53.674Z...IC Jul 15 17:43:53 . prometheus[22807]: level=info ts=2019-07-15T09:43:53.674Z...d" Jul 15 17:43:53 . prometheus[22807]: level=info ts=2019-07-15T09:43:53.674Z...ml Jul 15 17:43:53 . prometheus[22807]: level=info ts=2019-07-15T09:43:53.695Z...90 Jul 15 17:43:53 . prometheus[22807]: level=info ts=2019-07-15T09:43:53.698Z...ml Jul 15 17:43:53 . prometheus[22807]: level=info ts=2019-07-15T09:43:53.698Z...." Hint: Some lines were ellipsized, use -l to show in full.
设置服务开机启动 1 systemctl enable prometheus
也可以试一下重启系统,看服务会不会自动开启。
防火墙设置 因为我们的配置文件中配置的端口为9090
1 2 3 4 firewall-cmd --zone=public --add-port=9090/tcp --permanent # 重启防火墙服务 systemctl reload firewalld
访问页面 因为我是在虚拟机里安装的,直接在宿主机浏览器中输入: http://192.168.56.2:9090
安装exporter exporter是prometheus用来收集数据的客户端工具,在prometheus的官网上https://prometheus.io/download/ 可以下载到很多服务的exporter采集器。以下是我们经常用到的一些采集器:
Name Description URL Node Exporter 针对服务器进行监控的探测器(探针) https://github.com/prometheus/node_exporter Alert Manager 报警相关 https://github.com/prometheus/alertmanager Mysql Exporter MySQL服务监控相关的探测器 https://github.com/prometheus/mysqld_exporter Blackbox Exporter 黑盒监控解决方案,其允许用户通过:HTTP、HTTPS、DNS、TCP以及ICMP的方式对网络进行探测 https://github.com/prometheus/blackbox_exporter jmx_exporter JMX服务的探测器 https://github.com/prometheus/jmx_exporter
具体的可以到我们使用时再行在https://prometheus.io/download/或github中寻找需要的插件进行安装配置,这里我们就简单介绍几个常用的插件的安装和使用。
node_exporter node_exporter是一个服务器端agent,负责采集服务器基础监控项。下面我们就来一步一步安装node_exporter收集所在服务器的性能。
下载安装包 1 2 wget https://github.com/prometheus/node_exporter/releases/download/v0.18.1/node_exporter-0.18.1.linux-amd64.tar.gz tar -zvxf node_exporter-0.18.1.linux-amd64.tar.gz
添加执行用户 1 useradd -rs bin/false nodeusr
复制执行文件 1 cp node_exporter-0.18.1.linux-amd64/node_exporter usr/local/bin/
创建系统服务 1 vim etc/systemd/system/node_exporter.service
内容如下:
1 2 3 4 5 6 7 8 9 10 11 12 [Unit] Description=Node Exporter After=network.target [Service] User=nodeusr Group=nodeusr Type=simple ExecStart=/usr/local/bin/node_exporter [Install] WantedBy=multi-user.target
启动服务 1 2 systemctl daemon-reload systemctl start node_exporter
查看服务状态,如果正常的话会显示如下:
1 2 3 4 5 6 7 8 9 10 11 12 13 14 15 16 17 18 [root@ software]# systemctl status node_exporter ● node_exporter.service - Node Exporter Loaded: loaded (/etc/systemd/system/node_exporter.service; disabled; vendor preset: disabled) Active: active (running) since Mon 2019-07-15 20:10:48 CST; 20min ago Main PID: 30530 (node_exporter) CGroup: system.slice/node_exporter.service └─30530 usr/local/bin/node_exporter Jul 15 20:10:48 . node_exporter[30530]: time="2019-07-15T20:10:48+08:00" level=info msg=" - sockstat" source="node_exporter.go:104" Jul 15 20:10:48 . node_exporter[30530]: time="2019-07-15T20:10:48+08:00" level=info msg=" - stat" source="node_exporter.go:104" Jul 15 20:10:48 . node_exporter[30530]: time="2019-07-15T20:10:48+08:00" level=info msg=" - textfile" source="node_exporter.go:104" Jul 15 20:10:48 . node_exporter[30530]: time="2019-07-15T20:10:48+08:00" level=info msg=" - time" source="node_exporter.go:104" Jul 15 20:10:48 . node_exporter[30530]: time="2019-07-15T20:10:48+08:00" level=info msg=" - timex" source="node_exporter.go:104" Jul 15 20:10:48 . node_exporter[30530]: time="2019-07-15T20:10:48+08:00" level=info msg=" - uname" source="node_exporter.go:104" Jul 15 20:10:48 . node_exporter[30530]: time="2019-07-15T20:10:48+08:00" level=info msg=" - vmstat" source="node_exporter.go:104" Jul 15 20:10:48 . node_exporter[30530]: time="2019-07-15T20:10:48+08:00" level=info msg=" - xfs" source="node_exporter.go:104" Jul 15 20:10:48 . node_exporter[30530]: time="2019-07-15T20:10:48+08:00" level=info msg=" - zfs" source="node_exporter.go:104" Jul 15 20:10:48 . node_exporter[30530]: time="2019-07-15T20:10:48+08:00" level=info msg="Listening on :9100" source="node_exporter.go:170"
设置服务开机自启动 1 systemctl enable node_exporter
开启防火墙 如果防火墙服务有开启的话,就需要开通端口: 9100
1 2 firewall-cmd --zone=public --add-port=9100/tcp --permanent systemctl restart firewalld
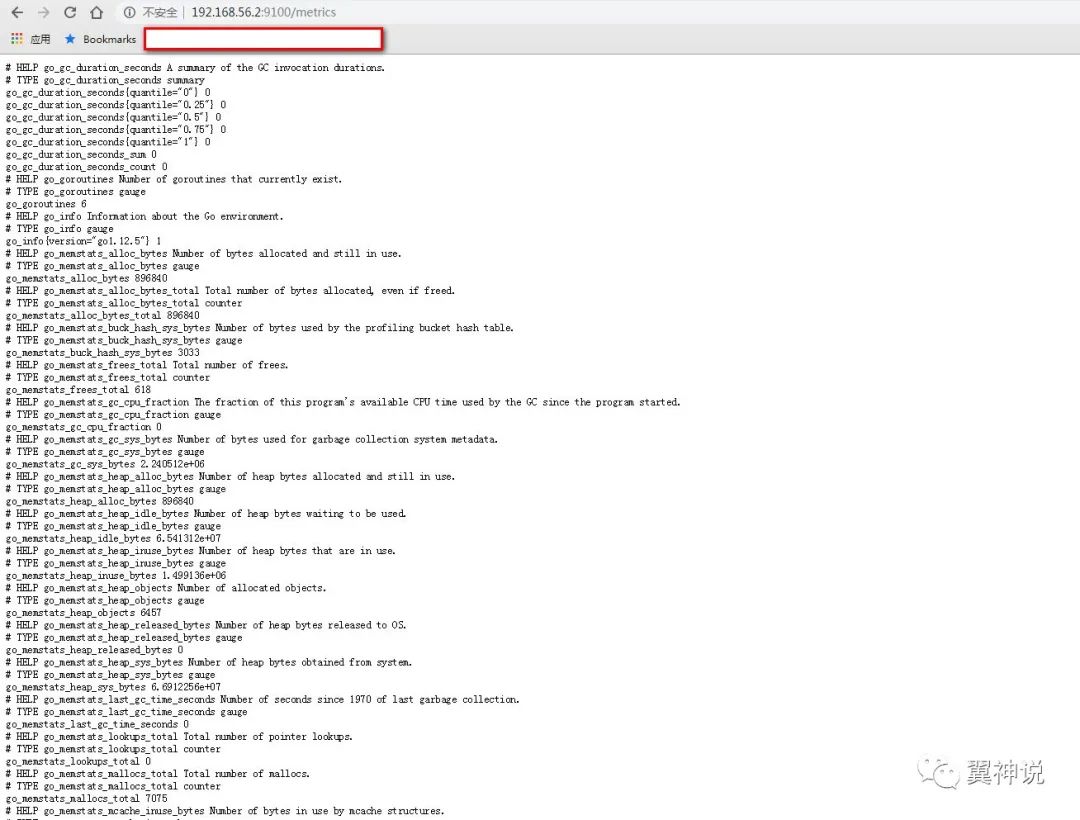
查看服务 在宿主机浏览器输入http://192.168.56.2:9100/metrics
将node_exporter加入prometheus的配置 1 vim /etc/prometheus/prometheus.yml
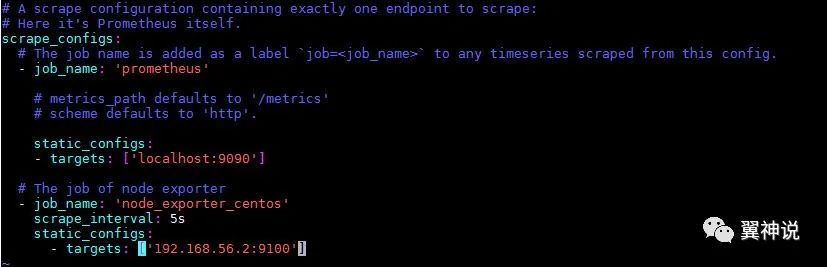
在prometheus.xml中的scrape配置项中加入以下内容:
1 2 3 4 - job_name: 'node_exporter_centos' scrape_interval: 5s static_configs: - targets: ['192.168.56.2:9100']
最终的配置文件如下:
然后重新启动prometheus服务。
1 systemctl restart prometheus
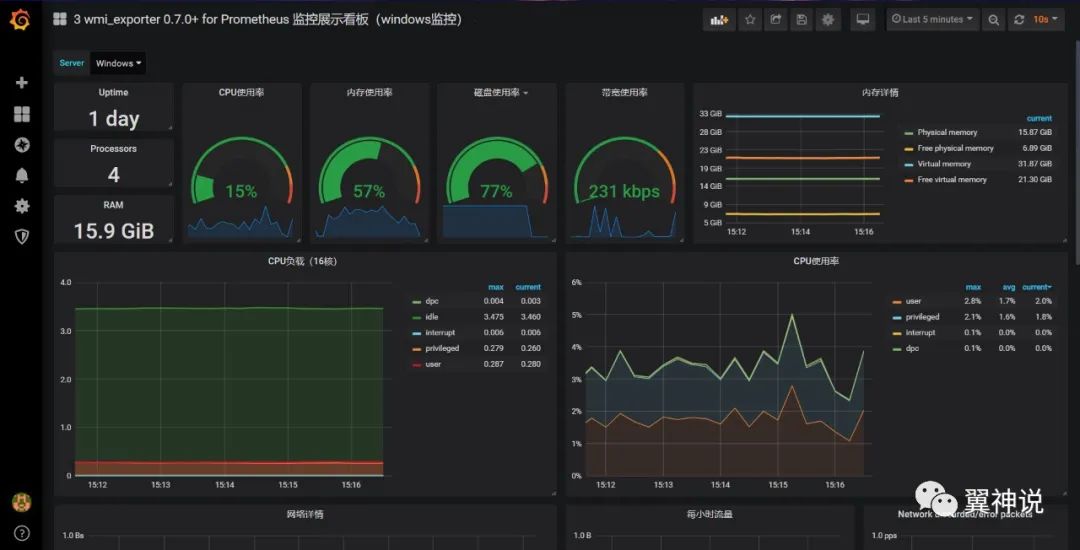
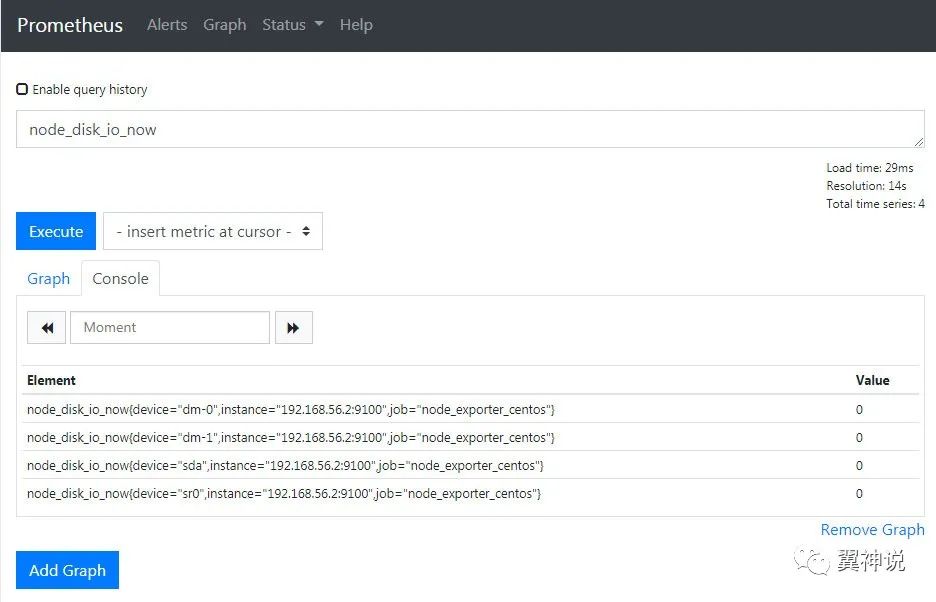
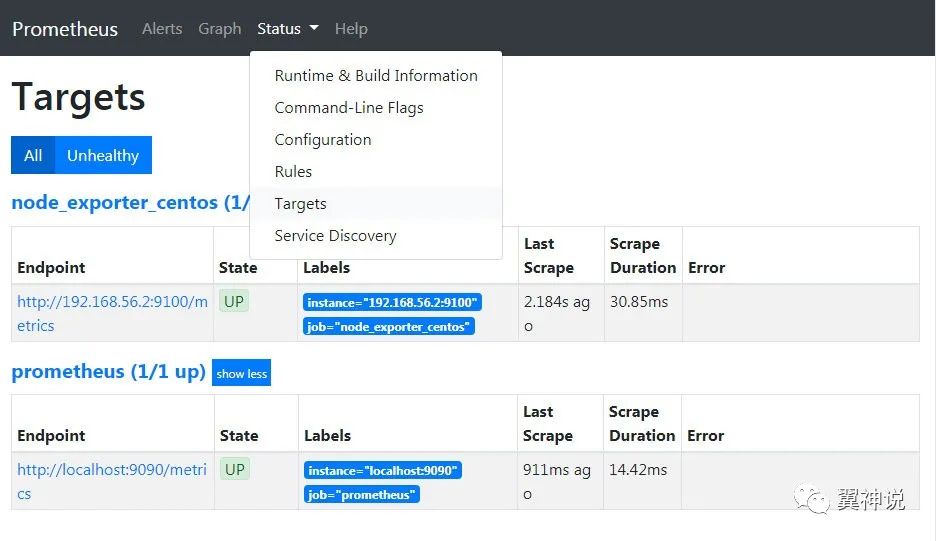
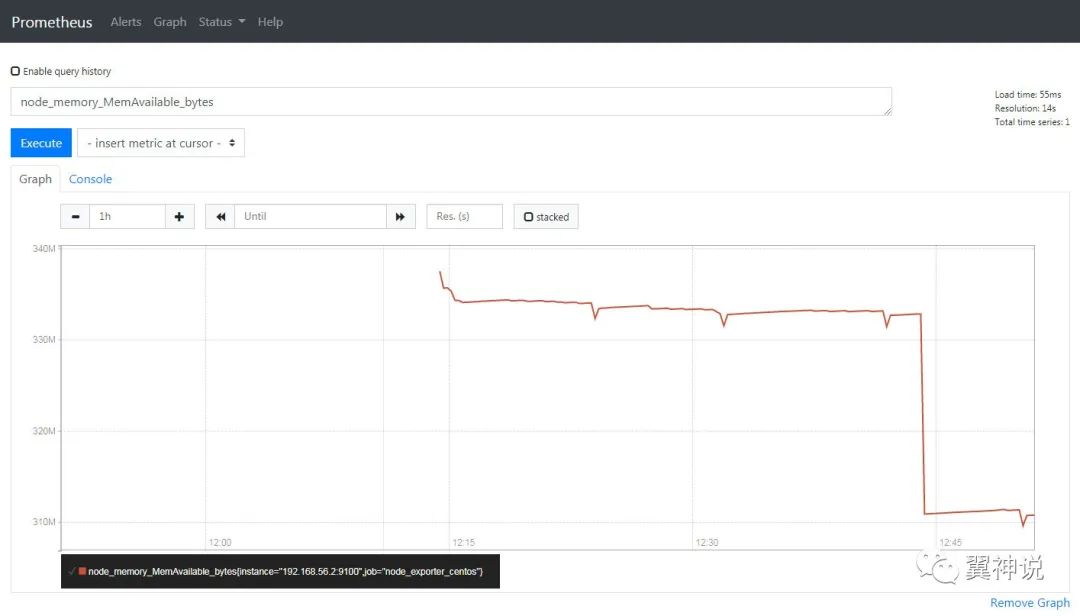
prometheus中查看node_exporter的数据 在宿主机的浏览器中输入prometheus的地址, http://192.168.56.2:9090/graph
Alert Manager 下载二进制安装包 1 2 3 export VERSION=0.18.0 curl -LO https://github.com/prometheus/alertmanager/releases/download/v$VERSION/alertmanager-$VERSION.darwin-amd64.tar.gz tar xvf alertmanager-$VERSION.darwin-amd64.tar.gz
参考文档