


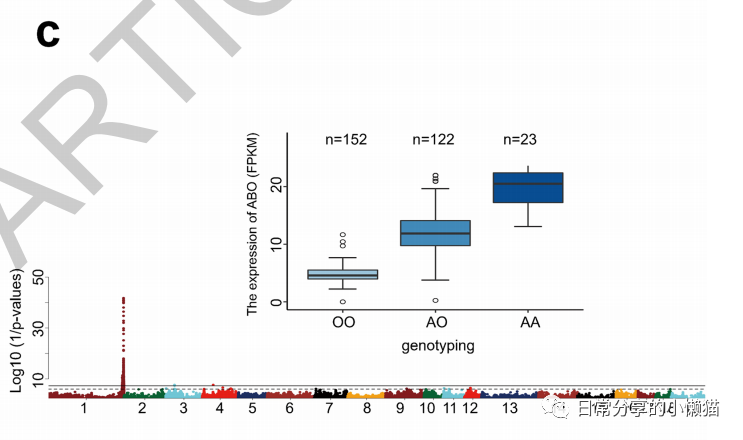
本文主要展示如何利用R语言绘制来自nature期刊ABO genotype alters the gut microbiota by regulating GalNAc levels in pigs(Hui Yang, et al,2022)[1]一文中的Extended Data Fig.5c。该图形式为箱线图,并添加了每组样本的数量。如下图所示: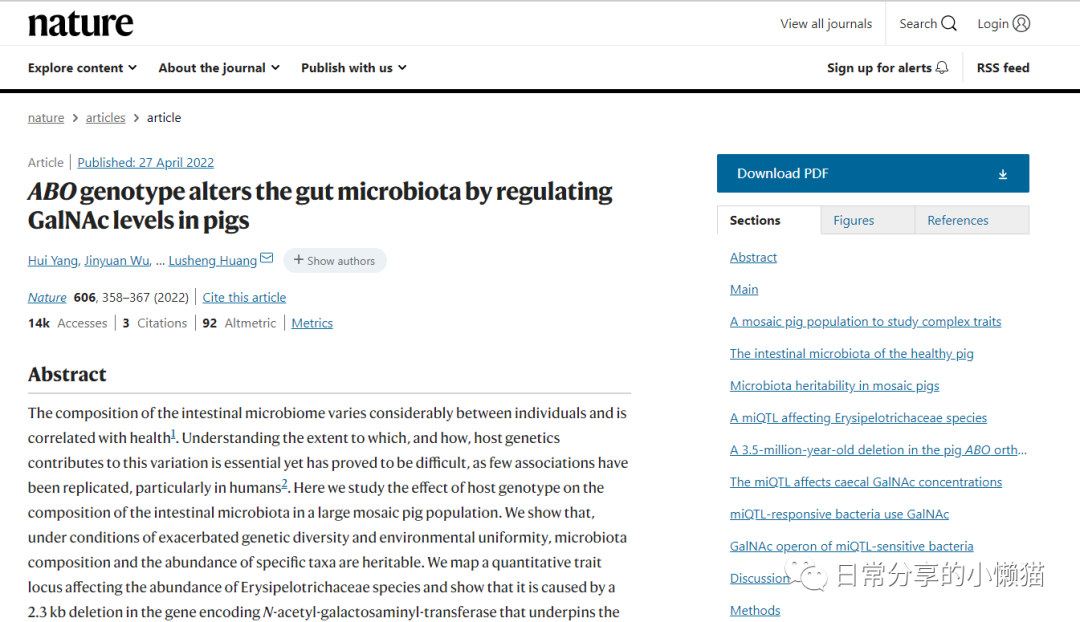
1、图形绘制
library(ggplot2)
library(EnvStats)
library(dplyr)

ED.fig5 <- read.table("ABO_topSNPExp.txt", header = TRUE)
ED.fig5$Genotype <- factor(ED.fig5$Genotype, levels = ED.fig5$Genotype %>% unique())
head(ED.fig5)
#  Genotype GeneExp_UNC
#1       OO          NA
#2       OO          NA
#3       OO          NA
#4       OO          NA
#5       AO          NA
#6       OO          NA
str(ED.fig5)
#'data.frame': 668 obs. of  2 variables:
# $ Genotype   : Factor w/ 3 levels "OO","AO","AA": 1 1 1 1 2 1 2 1 2 2 ...
# $ GeneExp_UNC: num  NA NA NA NA NA NA NA NA NA NA ...

#绘图
ggplot(ED.fig5, aes( Genotype, GeneExp_UNC, fill = Genotype)) +
  geom_boxplot(outlier.shape = 1) +
  stat_n_text(size = 5, y.pos = 27) +
  scale_y_continuous(limits = c(0,28)) +
  theme_classic() +
  scale_fill_brewer() +
  theme(legend.position = "none",
        axis.text = element_text(size = 12, colour = "black"),
        axis.title = element_text(size = 15),
        axis.line = element_line(size = 1)) +
  labs(x = "Genotype",y = "The expression of ABO gene (FPKM)")
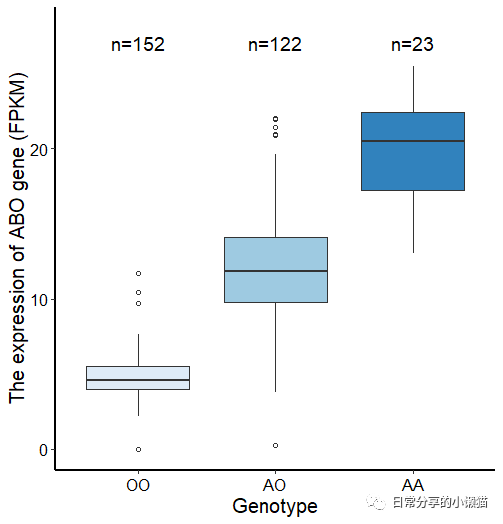 该图绘制较为简洁,关键点在于如何添加样本数量,需要使用到EnvStats包中的stat_n_text() 函数。
2、其他
其他绘图方法可进一步阅读公众号其他文章。
如有帮助请多多点赞哦!
参考资料
Yang, H., Wu, J., Huang, X. et al. ABO genotype alters the gut microbiota by regulating GalNAc levels in pigs. Nature 606, 358–367 (2022). : https://doi.org/10.1038/s41586-022-04769-z
文章转载自日常分享的小懒猫,如果涉嫌侵权,请发送邮件至:contact@modb.pro进行举报,并提供相关证据,一经查实,墨天轮将立刻删除相关内容。
