


本文主要介绍在ggplot2中绘制箱线图、小提琴图等图形时,如何在图形中添加样本数量。主要使用到EnvStats[1]包,绘图效果如下图所示: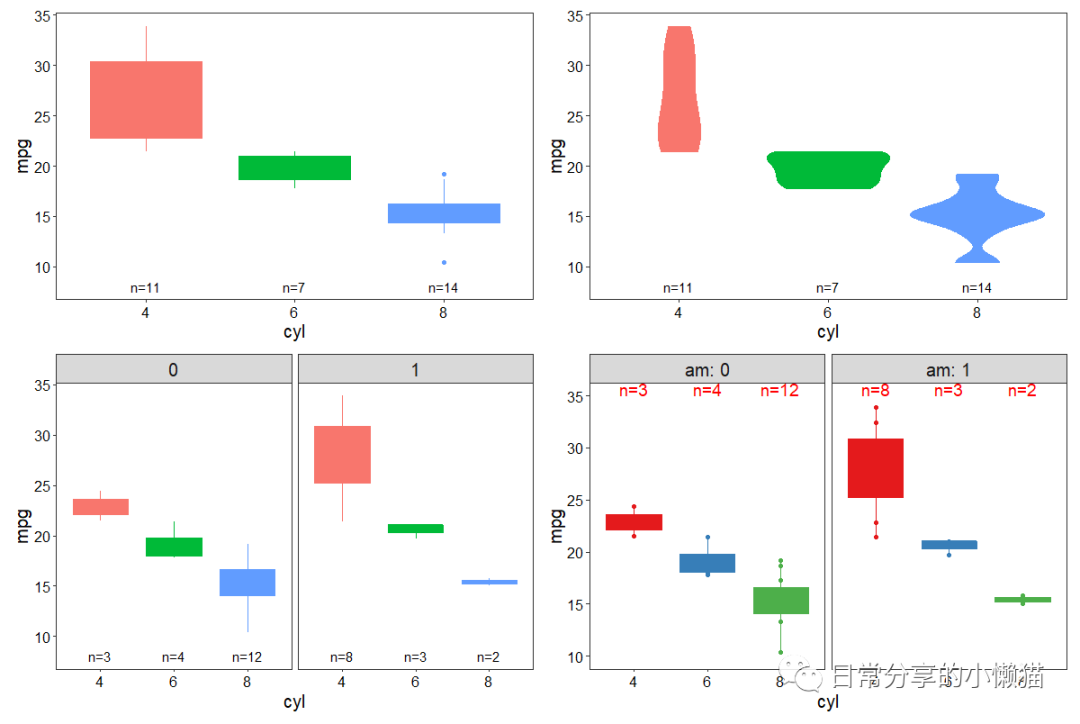
1、绘图准备
library(EnvStats)
library(ggplot2)
library(dplyr)
mtcars.df <- mtcars %>% select(mpg, cyl, am) %>%  mutate(across(all_of(c("cyl", "am")), factor))
head(mtcars.df)
#                   mpg cyl am
#Mazda RX4         21.0   6  1
#Mazda RX4 Wag     21.0   6  1
#Datsun 710        22.8   4  1
#Hornet 4 Drive    21.4   6  0
#Hornet Sportabout 18.7   8  0
#Valiant           18.1   6  0
str(mtcars.df)
#'data.frame': 32 obs. of  3 variables:
# $ mpg: num  21 21 22.8 21.4 18.7 18.1 14.3 24.4 22.8 19.2 ...
# $ cyl: Factor w/ 3 levels "4","6","8": 2 2 1 2 3 2 3 1 1 2 ...
# $ am : Factor w/ 2 levels "0","1": 2 2 2 1 1 1 1 1 1 1 ...

# 定义主题
my.theme <- theme_bw() +
  theme(legend.position = "none",
        axis.text = element_text(size = 12, colour = "black"),
        panel.grid = element_blank(),
        strip.text = element_text(size = 15),
        axis.title = element_text(size = 15, colour = "black"))
2、图形绘制
基本图形
ggplot(mtcars.df, aes(x = cyl, y = mpg, fill = cyl, color = cyl)) +
  geom_boxplot() +
  stat_n_text() +
  my.theme

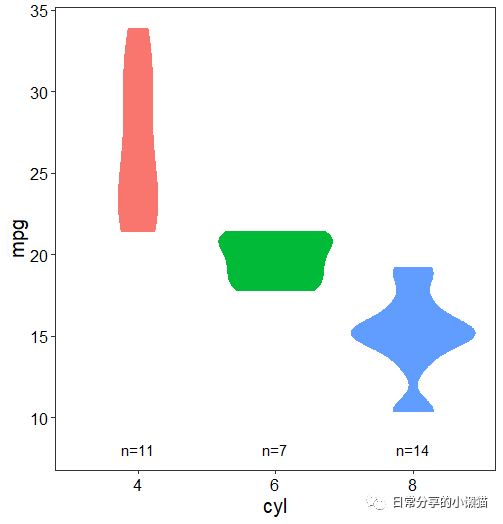
ggplot(mtcars.df, aes(x = cyl, y = mpg, fill = cyl, color = cyl)) +
  geom_violin() +
  stat_n_text() +
  my.theme
分面
ggplot(mtcars.df, aes(x = cyl, y = mpg, fill = cyl, color = cyl)) +
  geom_boxplot() +
  stat_n_text() +
  facet_wrap(~am) +
  my.theme

3、参数调整
ggplot(mtcars.df, aes(x = cyl, y = mpg, fill = cyl, color = cyl)) +
  geom_boxplot() +
  geom_point() +
  stat_n_text(size = 5, y.pos = 35, vjust = 0, color = "red") +
  scale_y_continuous(limits = c(10,35)) +
  facet_wrap(~ am, labeller = label_both) +
  scale_color_brewer(palette = "Set1") +
  scale_fill_brewer(palette = "Set1")  +
  my.theme
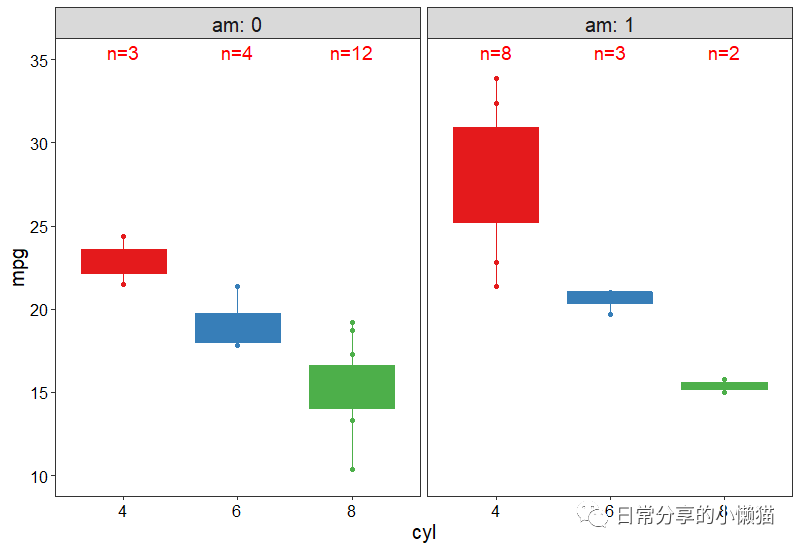
可以在stat_n_text() 函数中通过对size、y.pos、vjust、color等参数的设置,进一步调整样本数量标签属性。
4、其他
可使用help(stat_n_text) 命令进一步参考函数具体参数解读。其他绘图方法可进一步阅读公众号其他文章。
如有帮助请多多点赞哦!
参考资料
EnvStats: https://cran.r-project.org/web/packages/EnvStats/index.html
文章转载自日常分享的小懒猫,如果涉嫌侵权,请发送邮件至:contact@modb.pro进行举报,并提供相关证据,一经查实,墨天轮将立刻删除相关内容。
