


大家好,今天和大家分享一下PG的日志和ELK的整合。
众所周知, 目前ELK是业界十分流行的日志收集,监控,展示的集成平台。 数据库最为运维组件中最重要的一环,自然也会把自身的日志集成到公司的ELK的平台中, 以便可视化的展示和分析数据库相关的一些日志信息: 例如审计相关的账户异常登录等信息, 性能相关的慢SQL的监控。
本文不涉及到ELK的平台的基本搭建,对于初学者来说建议选择docker 的运行的方式,有集成好的ELK镜像,直接运行即可。
可以参考大表哥之前的文章: https://www.modb.pro/db/336848 (Docker 中运行ELK)
如果是公司级别的ELK平台搭建,需要考虑到日志量每天的大小,以及日志在ES 中的保存时间策略,检索索引的创建,保证ES在存储空间上和性能上的平衡。
(很多互联网公司每天的增量日志都是TB级别的,总量都是PB级别的)
接下来, 我们以PG数据库为例整合到ELK平台中:
1)打开PG 日志相关的参数:
这个部分我们参考filebeat 的 官方文档 https://www.elastic.co/guide/en/beats/filebeat/current/filebeat-module-postgresql.html
log_line_prefix = '%m [%p] %q%u@%d '  --日志的格式 时间戳 进程号 用户@数据库
log_duration = 'on'     --记录执行的时长
log_statement = 'none'  --建议关闭,有助于filebeat的阅读
log_min_duration_statement = 300 --慢SQL记录 大于300毫秒
log_checkpoints = 'on'; --记录checkpoint的信息
log_connections = 'on'; --记录connections 的信息
log_disconnections = 'on';  --记录disconnections 的信息
log_lock_waits = 'on';  --记录锁的信息
logging_collector = 'on'; --打开日志
log_destination = 'csvlog'; --CSV的日志格式,方便logstash 解析和过滤
官网filebeat 建议是 关闭参数 log_statement : 原因是 log_statement 和 log_duration 同时打开的话,会记录到不同的行上,导致filebeat 不能够很好的关联他们。
(When using log_statement and log_duration together, statements and durations are logged in different lines, and Filebeat is not able to correlate both values, for this reason it is recommended to disable log_statement.)
个人的建议是 不要打开log_duration 这个参数,否则的话会产生海量的日志!!!
2)下载安装filebeat
INFRA [postgres@wqdcsrv3352 postgreSQL]# curl -L -O https://artifacts.elastic.co/downloads/beats/filebeat/filebeat-7.15.0-x86_64.rpm
 % Total    % Received % Xferd  Average Speed   Time    Time     Time  Current
                                Dload  Upload   Total   Spent    Left  Speed
100 33.9M  100 33.9M    0     0  5012k      0  0:00:06  0:00:06 --:--:-- 8348k
安装filebeat 的RPM:
INFRA [postgres@wqdcsrv3352 filebeat]# sudo rpm -vi filebeat-7.15.0-x86_64.rpm
warning: filebeat-7.15.0-x86_64.rpm: Header V4 RSA/SHA512 Signature, key ID d88e42b4: NOKEY
Preparing packages...
filebeat-7.15.0-1.x86_64
3)enable postgesql module
INFRA [root@wqdcsrv3352 filebeat]#  filebeat modules enable postgresql
Enabled postgresql

INFRA [root@wqdcsrv3352 filebeat]#  filebeat modules list | grep postgresql
postgresql
4)修改 filebeat的配置文件:
rpm 的安装方式的配置文件在: /etc/filebeat/modules.d/postgresql.yml
var.paths: postgres 数据库日志的路径
input.tags: 为输入的日志打个标签
- module: postgresql
  # All logs
  log:
    enabled: true
    var.paths: ["/data/postgreSQL/2004/data/log/postgresql-*.csv"]
    input.tags: ["uat-postgres-log"]
修改/etc/filebeat/filebeat.yml 文件:
filebeat.config.modules:
 path: ${path.config}/modules.d/*.yml
 reload.enabled: false


setup.template.settings:
 index.number_of_shards: 3


output.logstash:    #输出至Docker 中logstash
 hosts: ["10.67.200.39:5044"]


processors:
 - add_host_metadata: ~
 - add_cloud_metadata: ~
 - drop_fields:      #删除无用的字段
     fields: ["beat", "input", "source", "offset", "prospector"]
5)启动filebeat的服务:
我们从输出的日志中可以看到 :输出管道到logstash 中已经建立了连接。 pipeline/output.go:151 Connect…established
INFRA [root@wqdcsrv3352 filebeat]# service filebeat status
● filebeat.service - Filebeat sends log files to Logstash or directly to Elasticsearch.
  Loaded: loaded (/usr/lib/systemd/system/filebeat.service; disabled; vendor preset: disabled)
  Active: active (running) since Sun 2022-10-09 15:58:48 CST; 1min 58s ago
    Docs: https://www.elastic.co/beats/filebeat
Main PID: 16033 (filebeat)
  Memory: 53.9M
  CGroup: /system.slice/filebeat.service
          └─16033 /usr/share/filebeat/bin/filebeat --environment systemd -c /etc/filebeat/filebeat.yml --path.home /usr/share/filebeat --path.config /etc/filebeat --path.data /var/lib/f...


Oct 09 15:58:48 wqdcsrv3352.cn.infra filebeat[16033]: 2022-10-09T15:58:48.398+0800        INFO        cfgfile/reload.go:224        Loading of config files completed.
Oct 09 15:58:51 wqdcsrv3352.cn.infra filebeat[16033]: 2022-10-09T15:58:51.387+0800        INFO        [add_cloud_metadata]        add_cloud_metadata/add_cloud_metadata.go:101 ...t detected.
Oct 09 15:59:18 wqdcsrv3352.cn.infra filebeat[16033]: 2022-10-09T15:59:18.397+0800        INFO        [monitoring]        log/log.go:184        Non-zero metrics in the last 30s        {"...
Oct 09 15:59:48 wqdcsrv3352.cn.infra filebeat[16033]: 2022-10-09T15:59:48.401+0800        INFO        [monitoring]        log/log.go:184        Non-zero metrics in the last 30s        {"...
Oct 09 16:00:18 wqdcsrv3352.cn.infra filebeat[16033]: 2022-10-09T16:00:18.398+0800        INFO        [monitoring]        log/log.go:184        Non-zero metrics in the last 30s        {"...
Oct 09 16:00:38 wqdcsrv3352.cn.infra filebeat[16033]: 2022-10-09T16:00:38.406+0800        INFO        [input.harvester]        log/harvester.go:309        Harvester started for file.    ...
Oct 09 16:00:39 wqdcsrv3352.cn.infra filebeat[16033]: 2022-10-09T16:00:39.406+0800        INFO        [publisher_pipeline_output]        pipeline/output.go:143        Connecti...0.39:5044))
Oct 09 16:00:39 wqdcsrv3352.cn.infra filebeat[16033]: 2022-10-09T16:00:39.406+0800        INFO        [publisher]        pipeline/retry.go:219        retryer: send unwait signal to consumer
Oct 09 16:00:39 wqdcsrv3352.cn.infra filebeat[16033]: 2022-10-09T16:00:39.406+0800        INFO        [publisher]        pipeline/retry.go:223          done
Oct 09 16:00:39 wqdcsrv3352.cn.infra filebeat[16033]: 2022-10-09T16:00:39.407+0800        INFO        [publisher_pipeline_output]        pipeline/output.go:151        Connecti...established
Hint: Some lines were ellipsized, use -l to show in full.
6)配置 logstash 的配置文件 postgres_log_uat.conf
input {
if "uat-postgres-log" in [tags]{
beats {
port => 5044
}
}
}

filter {

  csv {
            separator => ","
            columns => ["timestamp", "user","database","pid","hostname","session_id","serial_num","event_type","event_time","offset","offsetnum","log","logoffset","message"]
        }


}
output {
if "uat-postgres-log" in [tags]{
                 elasticsearch {
                        hosts => "localhost:9200"
                        index => "uat-postgres-log-%{+YYYY-MM-dd}"
                 }

}
}
7)重启logstash 进程
root@7a990f1bcae0:/etc/logstash/conf.d# /opt/logstash/bin/logstash --path.settings /etc/logstash -f /etc/logstash/conf.d/postgres_log_uat.conf --config.reload.automatic &
[1] 15867
8)下一步 我们登陆kibana, 配置一下 这个logstatsh 数据源的ES索引
Managenent-> stack management

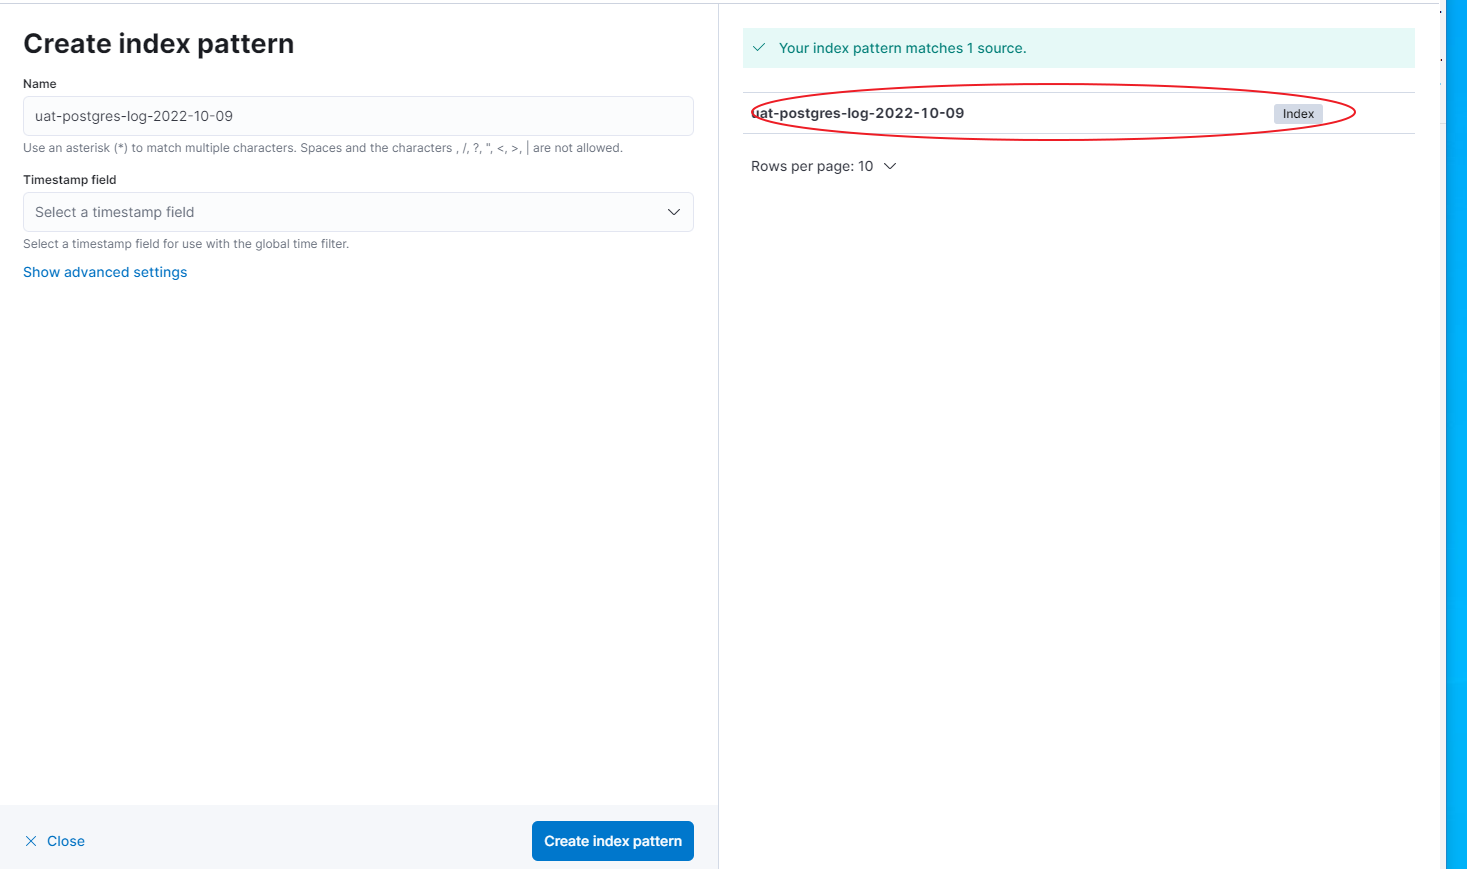
创建索引: index patterns
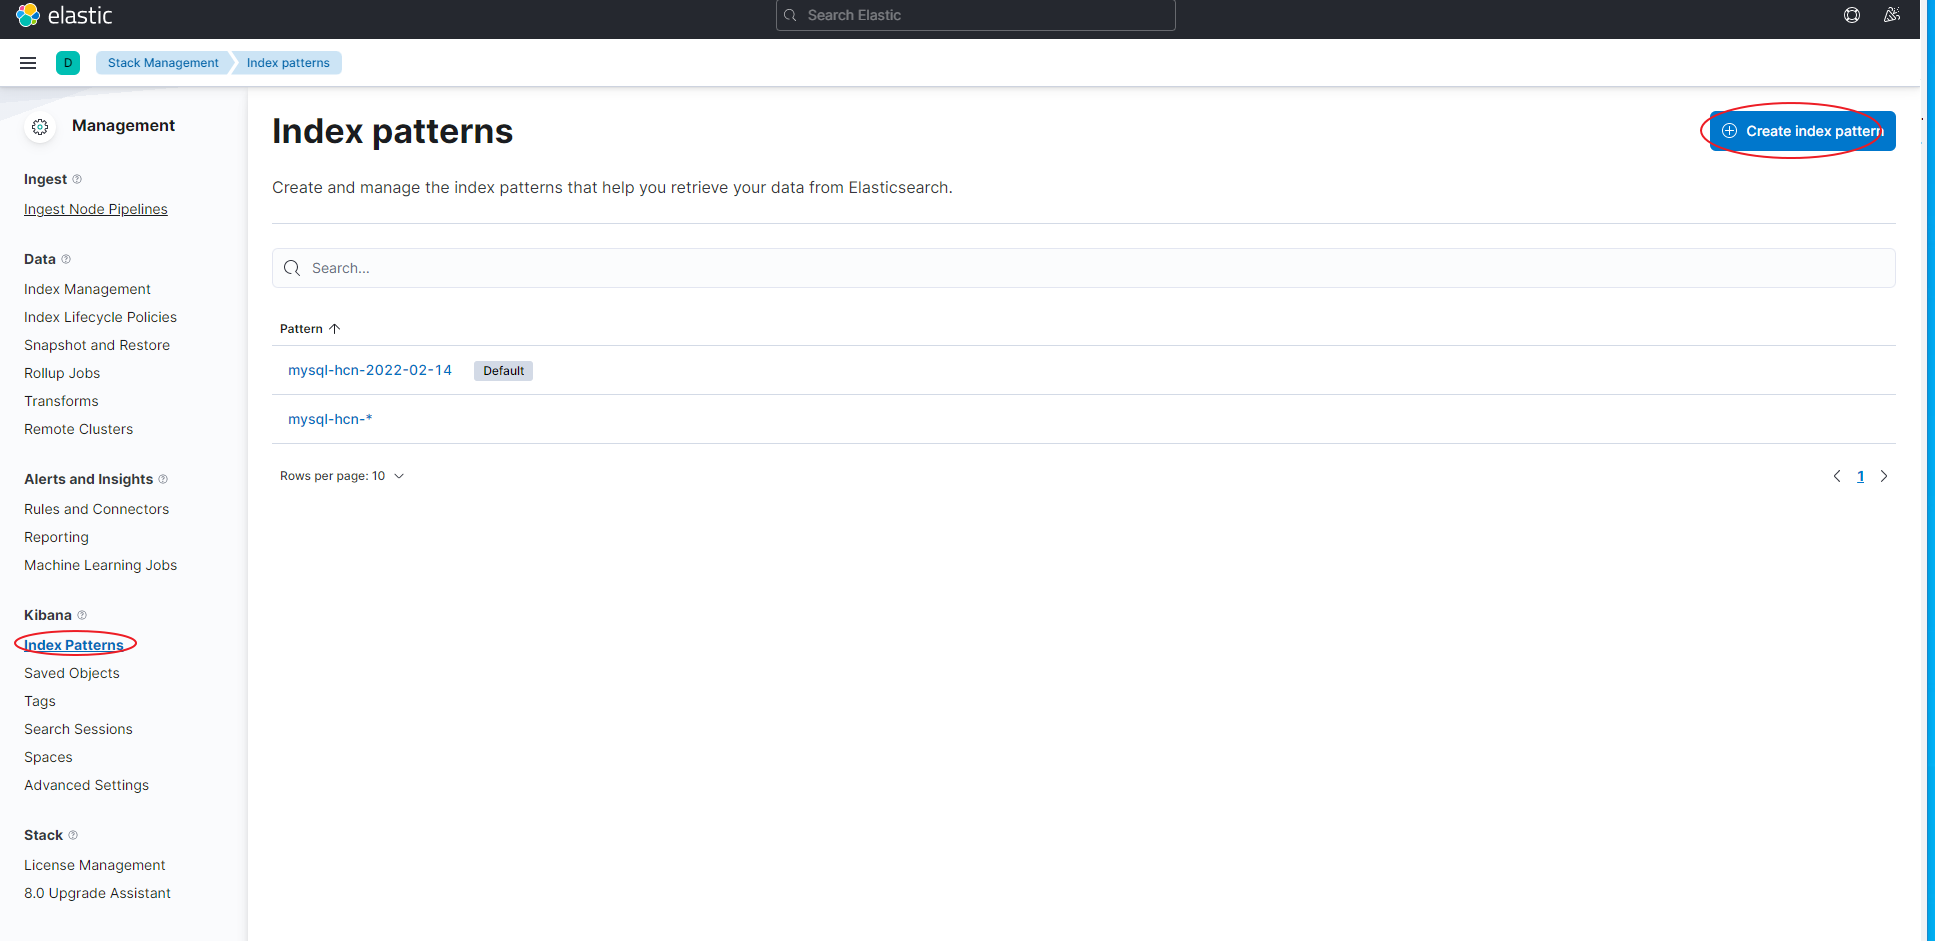
选择我们之前打标记的 uat-postgres-log-
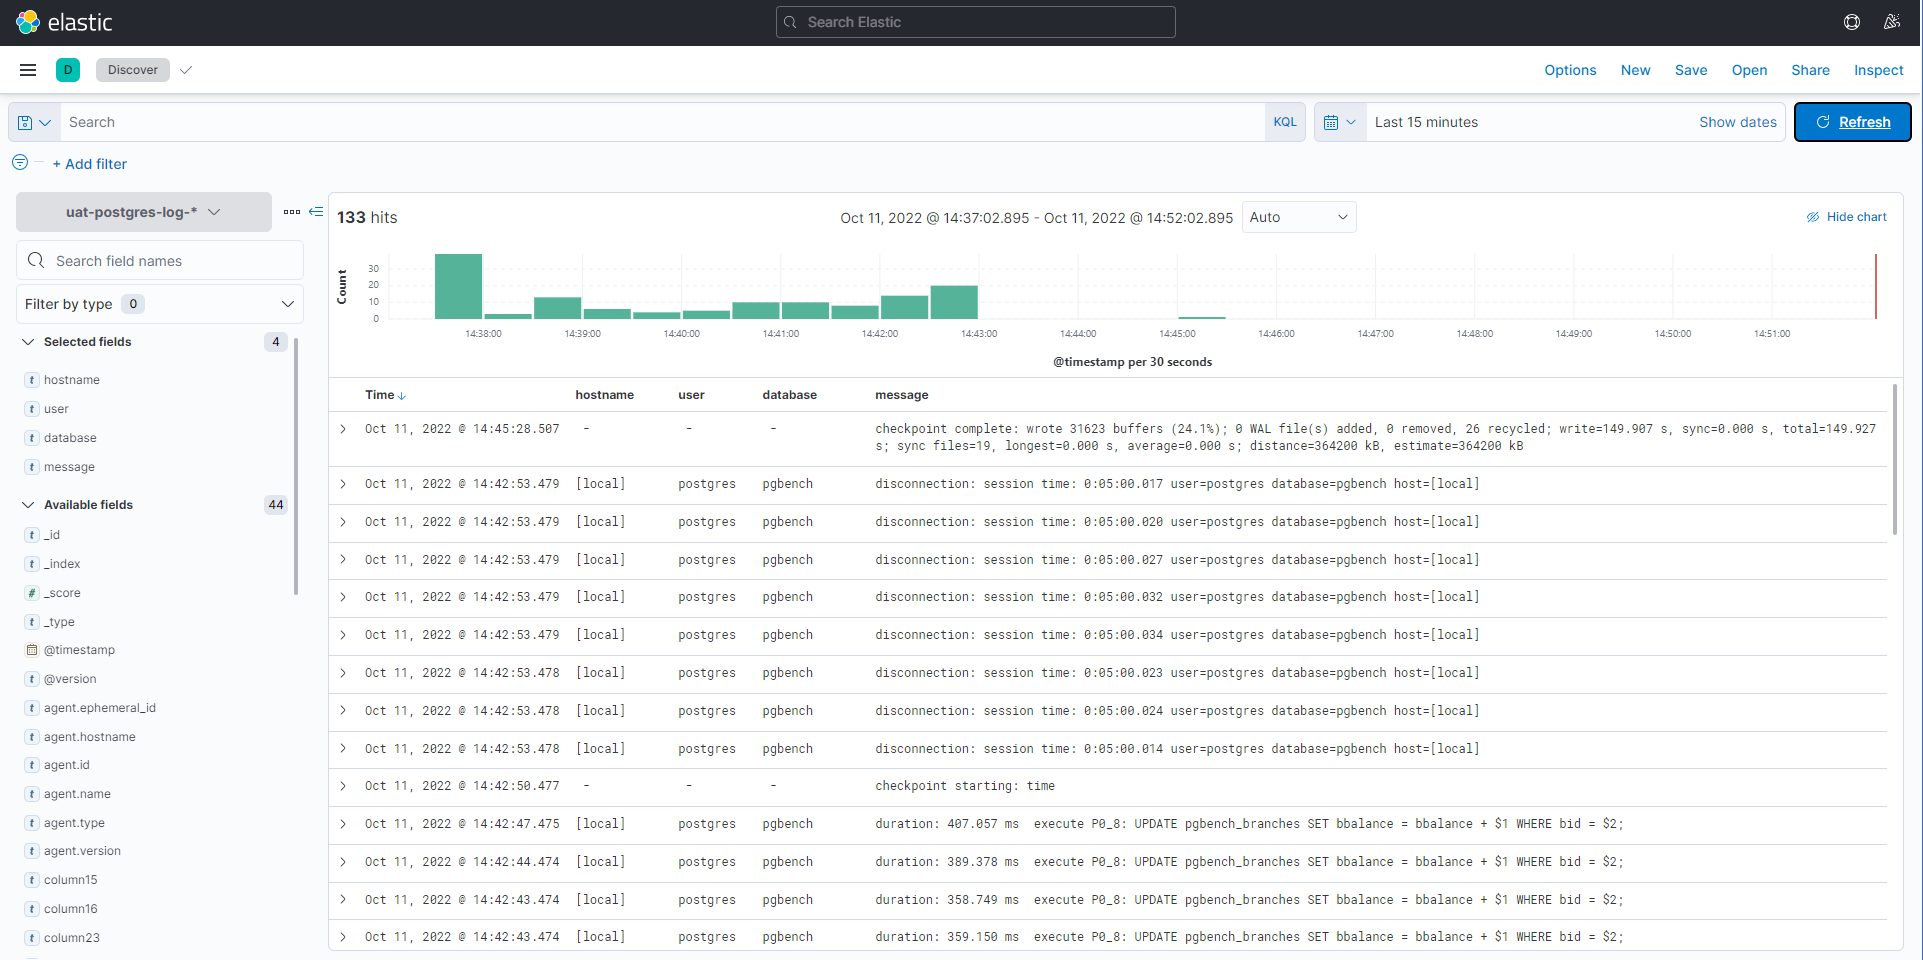
在Discover 视图中,查看日志的显示:
如果你只想展示一下慢SQL的显示,可以在logstash中添加过滤条件:“duration” in [message]
input {
if "uat-postgres-log" in [tags]{
beats {
port => 5044
}
}
}


filter {


if "duration" in [message]{
 csv {
           separator => ","
           columns => ["timestamp", "user","database","pid","hostname","session_id","serial_num","event_type","event_time","offset","offsetnum","log","logoffset","message"]
       }
}else{
 drop{}
}


}
output {
if "uat-postgres-log" in [tags]{
                elasticsearch {
                       hosts => "localhost:9200"
                       index => "uat-postgres-log-%{+YYYY-MM-dd}"
                }
}
}
再次启动后,便可以看见之前的登录和权限认证的信息都过滤掉了,只剩下了带有 执行时间信息 “duration“的SQL语句:
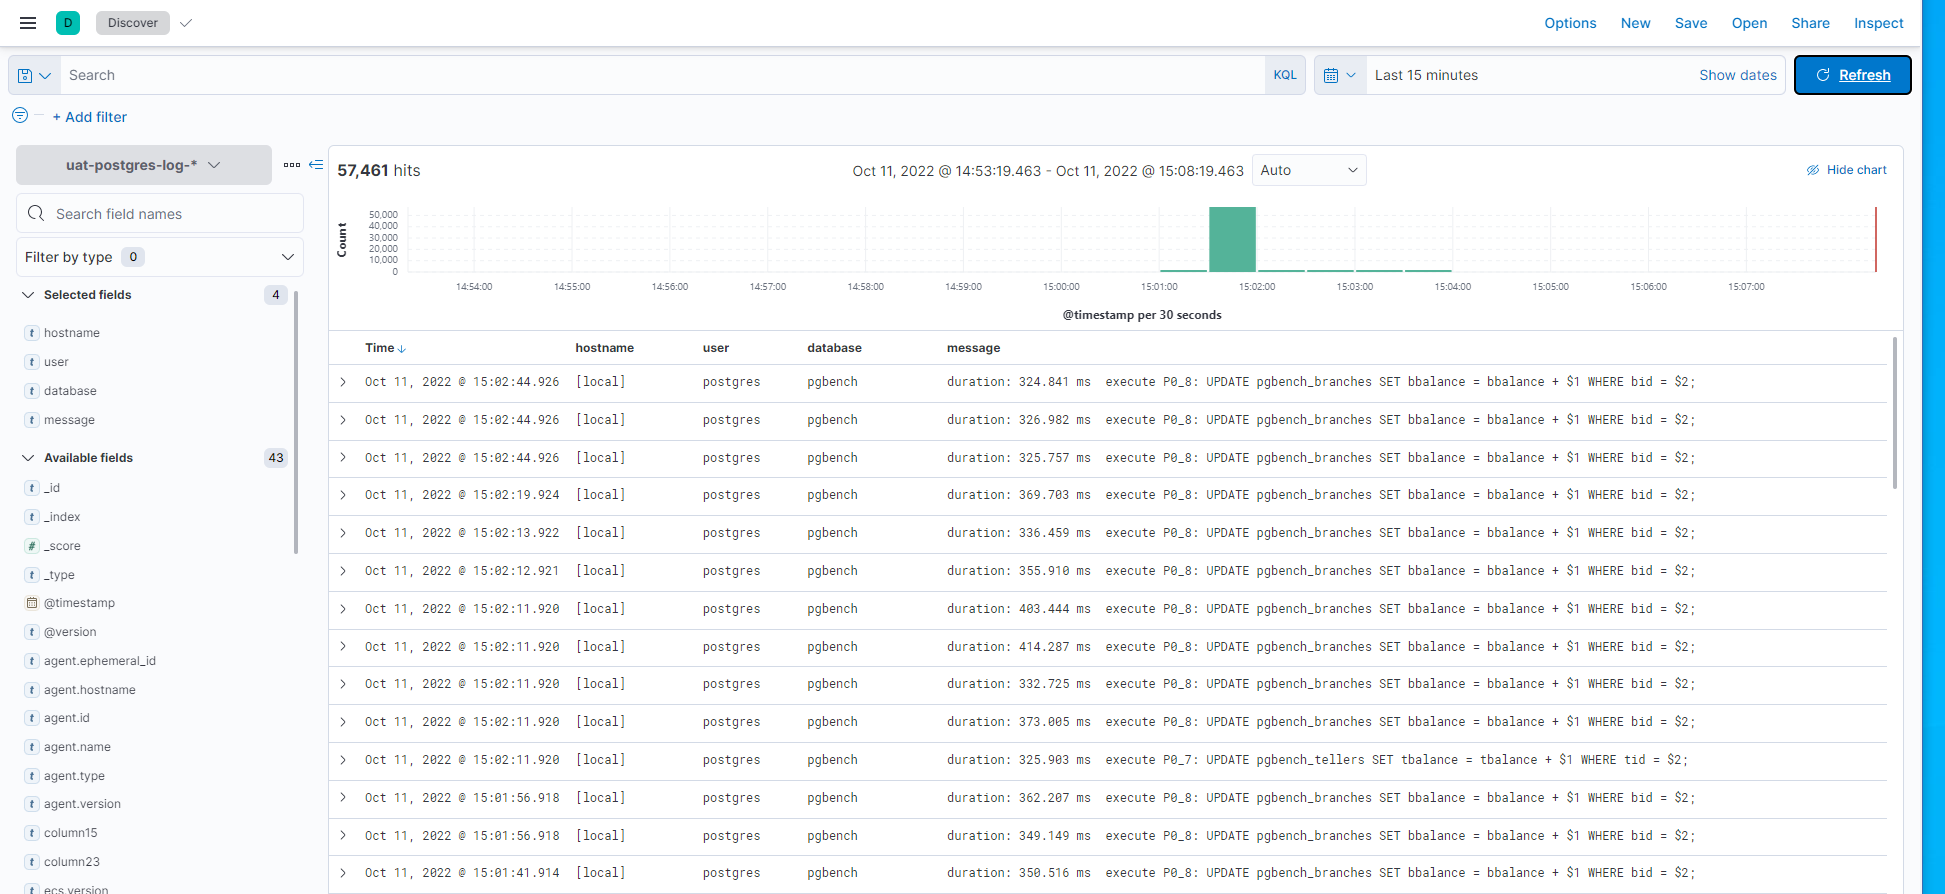
Have a fun 😃 !
