


适用范围
postgresql 12.x及以下版本
问题概述
pg 12.5上巡检发现pg_wal 目录占用空间很大,占用大小57G

问题原因
1.查看设置wal日志保留大小,最大保留4G

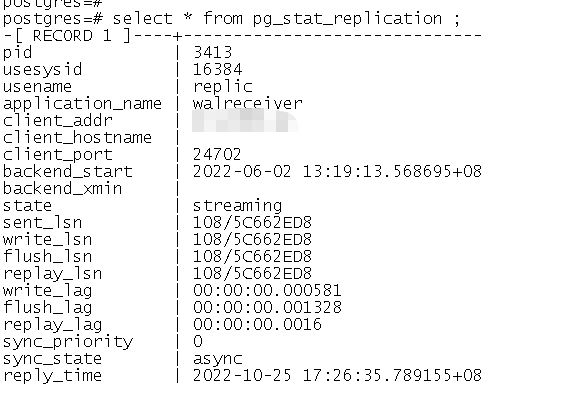
2.查看物理复制是否有延迟
replay_lag是0秒,说明没用延迟
3.查看是否有长时间执行的事物
查看执行时间30分钟超过的长事物或者查询
select pid,datname,usename,query,xact_start,now()-xact_start xact_duration,query_start,now()-query_start query_duration,state from pg_stat_activity where state<>$$idle$$ and (backend_xid is not null or backend_xmin is not null) and now()-xact_start > interval $$30 min$$ order by xact_start

4.查看事物槽
查看逻辑复制槽及物理复制槽运行状态及lsn延迟;
60391913112/1024/1024/1024约等于56.24G,并且这些slot_type为logical的复制槽都是false的,说明目前没用在使用中。
select pg_wal_lsn_diff(pg_current_wal_lsn(),restart_lsn), * from pg_replication_slots

5.查看发布表信息
查看发布表数据已经为空
select * from pg_publication_tables;

6.结论
存在多个失效的逻辑复制槽,导致wal日志无法进行清理;并且不存在发布表。
解决方案
1.删除失效的逻辑复制槽,然后做checkpoint
依次删除active为f的逻辑复制槽
postgres=# select pg_drop_replication_slot('account_statistics_etl_entires_accounts');

...
postgres=# select pg_drop_replication_slot('account_statistics_etl_entires_xxx');
postgres=# checkpoint;
2.检查空间
空间已经降低到80M
postgres=# \! du -sh /data/pg_data/*|grep pg_wal
80M     /data/pg_data/pg_wal
最后修改时间:2022-10-27 09:15:32
「喜欢这篇文章,您的关注和赞赏是给作者最好的鼓励」
关注作者
【版权声明】本文为墨天轮用户原创内容,转载时必须标注文章的来源(墨天轮),文章链接,文章作者等基本信息,否则作者和墨天轮有权追究责任。如果您发现墨天轮中有涉嫌抄袭或者侵权的内容,欢迎发送邮件至:contact@modb.pro进行举报,并提供相关证据,一经查实,墨天轮将立刻删除相关内容。
