前言
常言道兵马未至粮草先行,在ClickHouse上生产环境之前,我们就得制定好相关的监控方案,包括metrics采集、报警策略、图形化报表。有了全面有效的监控,就仿佛拥有了千里眼顺风耳,对于线上任何风吹草动都能及时感知,在必要的情况下提前介入以避免线上故障。
业界常用的监控方案一般是基于Prometheus + Grafana生态。本文将介绍由clickhouse-exporter(node-exporter) + Prometheus + Grafana组成的监控方案。
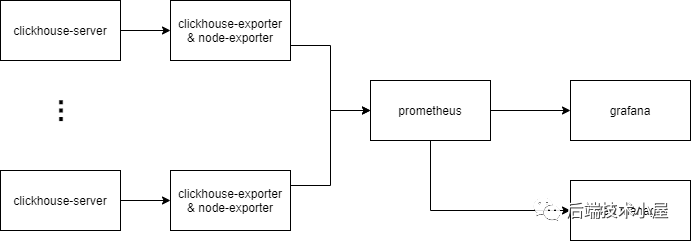
以上为监控方案示意图
clickhouse-server中有4个系统表会记录进程内部的指标,分别是 system.metrics
,system.asynchronous_metrics
,system.events
,system.partsclickhuse-exporter是一个用于采集ClickHouse指标的开源组件(https://github.com/ClickHouse/clickhouse_exporter),它会定时查询clickhouse-server中的系统表,转化成监控指标,并通过HTTP接口暴露给Prometheus. node-exporter是一个用于采集硬件和操作系统相关指标的开源组件(https://github.com/prometheus/node_exporter)。 Prometheus定时抓取clickhouse-exporter暴露的指标,并判断报警条件是否被触发,是则推送到alert manager DBA可通过 Grafana看板实时查看当前ClickHouse集群的运行状态 DBA可通过Alertmanager设置报警通知方式,如邮件、企业微信、电话等。
1 部署与配置
1.1 clickhouse-server
我们生产环境版本为20.3.8
,按照官方文档部署即可。
1.2 clickhouse-exporter
clickhouse-exporter一般与clickhouse-server同机部署。
首先下载最新代码并编译(需预先安装Go)
git clone https://github.com/ClickHouse/clickhouse_exportercd clickhouse_exportergo mod initgo mod vendorgo build ls ./clickhouse_exporter
然后启动
export CLICKHOUSE_USER="user"export CLICKHOUSE_PASSWORD="password"nohup ./-scrape_uri=http://localhost:port/ >nohup.log 2>&1 &
最后检查指标是否被正常采集:
> curl localhost:9116/metrics | head# TYPE clickhouse_arena_alloc_bytes_total counterclickhouse_arena_alloc_bytes_total 9.799096840192e+12# HELP clickhouse_arena_alloc_chunks_total Number of ArenaAllocChunks total processed# TYPE clickhouse_arena_alloc_chunks_total counterclickhouse_arena_alloc_chunks_total 2.29782524e+08# HELP clickhouse_background_move_pool_task Number of BackgroundMovePoolTask currently processed# TYPE clickhouse_background_move_pool_task gaugeclickhouse_background_move_pool_task 0# HELP clickhouse_background_pool_task Number of BackgroundPoolTask currently processed
1.3 node-exporter
node-exporter需与clickhouse-server同机部署
首先下载最新代码并编译
git clone https://github.com/prometheus/node_exportermake buildls ./node_exporter
然后启动
nohup ./node_exporter > nohup.log 2>&1 &
最后检查指标是否被正常采集
> curl localhost:9100/metrics# HELP go_gc_duration_seconds A summary of the GC invocation durations.# TYPE go_gc_duration_seconds summarygo_gc_duration_seconds{quantile="0"} 6.3563e-05go_gc_duration_seconds{quantile="0.25"} 7.4746e-05go_gc_duration_seconds{quantile="0.5"} 9.0556e-05go_gc_duration_seconds{quantile="0.75"} 0.000110677go_gc_duration_seconds{quantile="1"} 0.004362325go_gc_duration_seconds_sum 28.451282046go_gc_duration_seconds_count 223479...
1.4 Prometheus
修改Prometheus配置文件,添加Alertmanager地址、clickhouse-exporter地址
prometheus.yml示例如下:
global: scrape_interval: 15s # Set the scrape interval to every 15 seconds. Default is every 1 minute. evaluation_interval: 15s # Evaluate rules every 15 seconds. The default is every 1 minute.# Alertmanager configurationalerting: alertmanagers: - static_configs: - targets: - alertmanager:9093# Load rules once and periodically evaluate them according to the global 'evaluation_interval'.rule_files: - ./rules/*.rules# A scrape configuration containing exactly one endpoint to scrape:# Here it's Prometheus itself.scrape_configs: # The job name is added as a label `job=<job_name>` to any timeseries scraped from this config. - job_name: 'clickhouse' # metrics_path defaults to '/metrics' # scheme defaults to 'http'. static_configs: - targets: ['clickhouseexporter1:9116', 'clickhouseexporter2:9116', ...]
*.rules示例如下:
groups: - name: qps_too_high rules: - alert: clickhouse qps超出阈值 expr: rate(clickhouse_query_total[1m]) > 100 for: 2m labels: job: clickhouse-server severity: critical alertname: clickhouse qps超出阈值 annotations: summary: "clickhouse qps超出阈值" description: "clickhouse qps超过阈值(100), qps: {{ $value }}"
启动Prometheus
nohup ./prometheus --config.file=/path/to/config --storage.tsdb.path=/path/to/storage --web.external-url=prometheus --web.enable-admin-api --web.enable-lifecycle --log.level=warn >nohup.log 2>&1 &
浏览器输入http://prometheus_ip:9090
检查Prometheus状态
1.5 Alertmanager
首先修改配置文件
配置文件示例如下:
route: receiver: 'default' group_by: ['service','project']receivers:- name: "电话" webhook_configs: - url: <url>- name: "企业微信" webhook_configs: - url: <url>- name: "邮箱" webhook_configs: - url: <url>
然后启动
nohup ./alertmanager --config.file=/path/to/config --log.level=warn >nohup.log 2>&1 &
1.6 Grafana
关于ClickHouse的dashboard模板已经有很多,在这里推荐:https://grafana.com/grafana/dashboards/882 将它导入到新建的Grafana dashboard之后,即可得到漂亮的ClickHouse集群看板(可能需要微调)。
另外建议安装clickhouse datasource插件。有了这个插件便能在Grafana 中配置ClickHouse数据源,并通过ClickHouse SQL配置图表,详细文档见:https://grafana.com/grafana/plugins/vertamedia-clickhouse-datasource
2 重要指标和监控
我们可以看到,不管是node-exporter还是clickhouse-exporter,它们的指标种类很多,大概有几百个。我们的策略是抓大放小,对于重要的指标才设置报警策略并创建看板。
下面列举一些个人觉得比较重要的指标
2.1 系统指标
系统指标由node-exporter采集
| 指标名 | 指标含义 | 报警策略 | 策略含义 |
|---|---|---|---|
| node_cpu_seconds_total | 机器累计cpu时间(单位s) | 100 * sum without (cpu) (rate(node_cpu_seconds_total{mode='user'}[5m])) count without (cpu) (node_cpu_seconds_total{mode='user'}) > 80 | 用户态cpu利用率大于80%则报警 |
| node_filesystem_size_bytes/node_filesystem_avail_bytes | 机器上个文件分区容量/可用容量 | 100 * (node_filesystem_size_bytes{mountpoint="/data"} - node_filesystem_avail_bytes{mountpoint="/data"}) node_filesystem_size_bytes{mountpoint="/data"} > 80 | /data盘占用超过80%则报警 |
| node_load5 | 5分钟load值 | node_load5 > 60 | 5分钟load值超过60则报警(可根据具体情况设置阈值) |
| node_disk_reads_completed_total | 累计读磁盘请求次数 | rate(node_disk_reads_completed_total[5m]) > 200 | read iops超过200则报警 |
2.2 ClickHouse指标
| 指标名 | 指标含义 | 报警策略 | 策略含义 |
|---|---|---|---|
| clickhouse_exporter_scrape_failures_total | prometheus抓取exporter失败总次数 | increase(clickhouse_exporter_scrape_failures_total[5m]) > 10 | prometheus抓取export失败次数超过阈值则报警,说明此时ch服务器可能发生宕机 |
| promhttp_metric_handler_requests_total | exporter请求clickhouse失败总次数 | increase(promhttp_metric_handler_requests_total{code="200"}[2m]) == 0 | 2分钟内查询clickhouse成功次数为零则报警,说明此时某个ch实例可能不可用 |
| clickhouse_readonly_replica | ch实例中处于只读状态的表个数 | clickhouse_readonly_replica > 5 | ch中只读表超过5则报警,说明此时ch与zk连接可能发生异常 |
| clickhouse_query_total | ch已处理的query总数 | rate(clickhouse_query_total[1m]) > 30 | 单实例qps超过30则报警 |
| clickhouse_query | ch中正在运行的query个数 | clickhouse_query > 30 | 单实例并发query数超过阈值则报警 |
| clickhouse_tcp_connection | ch的TCP连接数 | clickhouse_tcp_connection > XXX | 略 |
| clickhouse_http_connection | ch的HTTP连接数 | clickhouse_http_connection > XXX | 略 |
| clickhouse_zoo_keeper_request | ch中正在运行的zk请求数 | clickhouse_zoo_keeper_request > XXX | 略 |
| clickhouse_replicas_max_queue_size | ch中zk副本同步队列的长度 | clickhouse_replicas_max_queue_size > 100 | zk副本同步队列长度超过阈值则报警,说明此时副本同步队列出现堆积 |
2.3 其他常用SQL
在ClickHouse中,所有被执行的Query都会记录到system.query_log
表中。因此我们可通过该表监控集群的查询情况。以下列举几种用于监控的常用SQL。为了更方便的查看,可添加到grafana看板中。
最近查询
SELECT event_time, user, query_id AS query, read_rows, read_bytes, result_rows, result_bytes, memory_usage, exception FROM clusterAllReplicas('cluster_name', system, query_log) WHERE (event_date = today()) AND (event_time >= (now() - 60)) AND (is_initial_query = 1) AND (query NOT LIKE 'INSERT INTO%') ORDER BY event_time DESC LIMIT 100
慢查询
SELECT event_time, user, query_id AS query, read_rows, read_bytes, result_rows, result_bytes, memory_usage, exception FROM clusterAllReplicas('cluster_name', system, query_log) WHERE (event_date = yesterday()) AND query_duration_ms > 30000 AND (is_initial_query = 1) AND (query NOT LIKE 'INSERT INTO%') ORDER BY query_duration_ms desc LIMIT 100
Top10大表
SELECT       database,       table,       sum(bytes_on_disk) AS bytes_on_disk  FROM clusterAllReplicas('cluster_name', system, parts)  WHERE active AND (database != 'system')
GROUP BY
    database,
    table
ORDER BY bytes_on_disk DESC
LIMIT 10
Top10查询用户
SELECT
    user,
    count(1) AS query_times,
    sum(read_bytes) AS query_bytes,
    sum(read_rows) AS query_rows
FROM clusterAllReplicas('cluster_name', system, query_log)
WHERE (event_date = yesterday()) AND (is_initial_query = 1) AND (query NOT LIKE 'INSERT INTO%')
GROUP BY user
ORDER BY query_times DESC
LIMIT 10
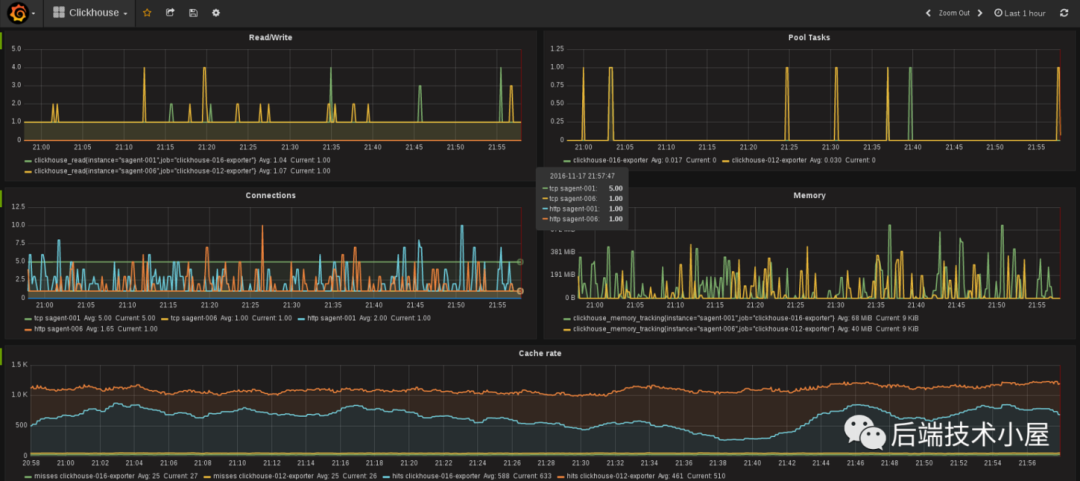
3 Grafana监控报表可视化展示
更多精彩内容,请扫码关注微信公众号:后端技术小屋。如果觉得文章对你有帮助的话,请多多分享、转发、在看。