


一、问题现象
同事反馈国外点在国内的XXX备库实例宕,尝试将该实例重启,结果重启报如下错误,未能正常启动该数据库。
Standby crash recovery failed to bring standby database to a consistent
point because needed redo hasn't arrived yet.
MRP: Wait timeout: thread 1 sequence# 0
Errors with log +DG/xxxx/archivelog/2021_12_29/thread_2_seq_24193.3766.1092589235
Standby Crash Recovery aborted due to error 16016.
Errors in file /u01/app/oracle/diag/rdbms/xxxx/xxxx/trace/xxxx_ora_67164.trc:
ORA-16016: archived log for thread 1 sequence# 22789 unavailable
Recovery interrupted!
Some recovered datafiles maybe left media fuzzy
Media recovery may continue but open resetlogs may fail
Completed Standby Crash Recovery.
Errors in file /u01/app/oracle/diag/rdbms/xxxx/xxxx/trace/xxxx_ora_67164.trc:
ORA-10458: standby database requires recovery
ORA-01196: file 1 is inconsistent due to a failed media recovery session
ORA-01110: data file 1: '+DG/xxxx/datafile/system.419.941189591'
ORA-10458 signalled during: ALTER DATABASE OPEN...
帮同事看了下问题,经过多次尝试,最终将数据库重新open,并正常接收主库传来的日志,数据库同步正常。
二、问题分析
问题看似解决了,其实只是做了一半,就是为什么这个实例会宕,另外就是这个数据库之前也配置了告警,为什么本次没有发出告警,要分析下原因,避免下次再重新改情况。
该数据库是国外点在国内的一个备库,和主库实时同步,数据库版本是Oracle 11.2.0.4 ,该数据库服务器上共部署了两个实例,而本次是只宕了其中一个实例,另一个实例正常。
首先查看了下问题发生时段的alert日志,在日志里看到了在数据库发生故障时所报的日志信息:
Errors in file /u01/app/oracle/diag/rdbms/xxxx/xxxx/trace/xxxx_lgwr_45171.trc:
ORA-04021: timeout occurred while waiting to lock object
LGWR (ospid: 45171): terminating the instance due to error 4021
Wed Dec 29 17:20:02 2021
System state dump requested by (instance=1, osid=45171 (LGWR)), summary=[abnormal instance termination].
System State dumped to trace file /u01/app/oracle/diag/rdbms/xxxx/xxxx/trace/xxxx_diag_45155_20211229172002.trc
Dumping diagnostic data in directory=[cdmp_20211229172002], requested by (instance=1, osid=45171 (LGWR)), summary=[abnormal instance termination].
Wed Dec 29 17:20:02 2021
ORA-1092 : opitsk aborting process
Wed Dec 29 17:20:02 2021
License high water mark = 49
Instance terminated by LGWR, pid = 45171
USER (ospid: 159932): terminating the instance
Instance terminated by USER, pid = 159932
Wed Dec 29 17:20:04 2021
Adjusting the default value of parameter parallel_max_servers
from 1280 to 970 due to the value of parameter processes (1000)
Starting ORACLE instance (normal)
************************ Large Pages Information *******************
Per process system memlock (soft) limit = 143 GB

Total Shared Global Region in Large Pages = 14 GB (75%)

Large Pages used by this instance: 7329 (14 GB)
Large Pages unused system wide = 6 (12 MB)
Large Pages configured system wide = 17000 (33 GB)
Large Page size = 2048 KB
从日志里可以看到由于产生了ORA-1092 : opitsk aborting process报错,导致该数据库实例宕。此时就要去分析是什么原因导致产生ORA-1092报错。首先看了下报错时产生的/u01/app/oracle/diag/rdbms/xxxx/xxxx/trace/xxxx_diag_45155_20211229172002.trc文件,文件内容太多,格式化输出后也不太好排查,希望能从其它地方获取到一些价值信息。
首先在MOS上查询了 ORA-1092 : opitsk aborting process报错原因,MOS上讲该问题产生的原因也比较多,此时尝试看下操作系统日志,看下是否有什么价值的信息。
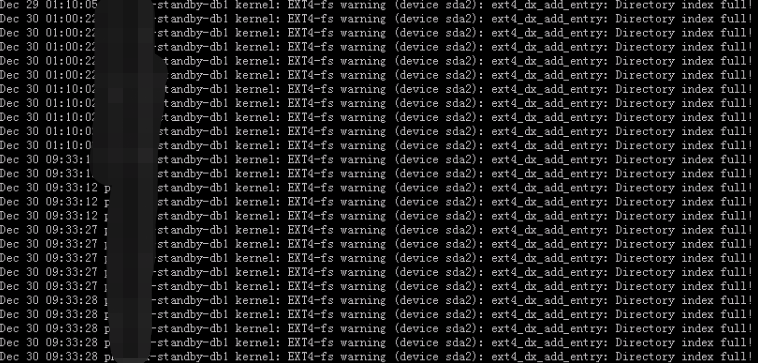
从操作系统的 /var/log/messages里,发现日志不停的有xxx-xxx-standby-db1 kernel: EXT4-fs warning (device sda2): ext4_dx_add_entry: Directory index full!这样的报错:
该报错的原因是因为 操作系统小文件太多,导致innode块被占用完了,然后查了下数据库相关文件,发现是两个数据库的审计文件占用了大量innode,通过du -sh 查看都被夯住了,是否是该问题导致数据库实例宕呢。
经查询该数据库已关闭了审计查询,但sys用户依然会产生大量审计文件。
三、问题处理
于是通过find 结合 xargs 和rm 将两个实例下的审计文件大量删除,并配置了定时清理任务,后续观察了几天,innode已经由原来的89%降到了当前的34%,操作系统日志未在报index full满的报错信息,备库和主库的同步也正常。
