


前言
作为一名程序员,遇到程序抛异常是难免的事,那如果发生了,如何去拿到程序异常的具体信息呢?特别是那种导致软件直接闪退的异常,因为那种异常,自己在软件里面写的日志压根就来不及记录软件就崩了。大叔接下来分享几种方式去查看具体的异常信息。
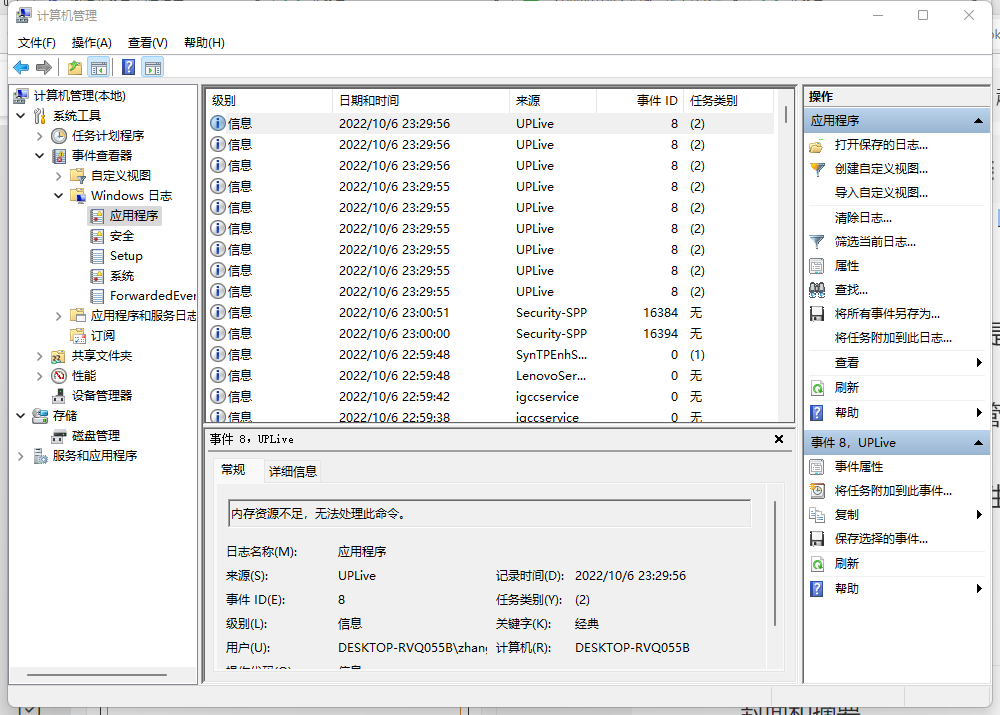
方式1:windowslog
这种方式是最简单也是最直接的一种方式,可以快速查看到自己的应用出现的异常。步骤
1、“我的电脑”右键到管理
2、点击“事件查看器”、点击“Windows日志”、点击“应用程序”
3、根据应用名称、发生时间进行筛选。
方式二:Dump文件分析
如果你觉得方式一得到的异常信息不够信息,想了解更多一点,那么你可以通过拿到出现异常状况之后的Dump文件,用windgb进行分析,方式如下
可以通过技巧1,查看线程,看看具体是哪个线程出现的异常,用指令!t
0:000> !tThreadCount: 43UnstartedThread: 0BackgroundThread: 39PendingThread: 0DeadThread: 1Hosted Runtime: noLockID OSID ThreadOBJ State GC Mode GC Alloc Context Domain Count Apt Exception.........73 12 1ca0 000002778351a030 202b220 Preemptive 0000000000000000:0000000000000000 00000277e4653c40 0 MTA74 61 3250 000002778351a800 3029220 Preemptive 0000000000000000:0000000000000000 00000277e4653c40 0 MTA (Threadpool Worker)84 54 1b88 00000277e46e27a0 1029220 Preemptive 0000000000000000:0000000000000000 00000277e4653c40 2 MTA (Threadpool Worker) System.Reflection.TargetInvocationException 00000277e781ef8085 58 28f8 000002778351cf10 3029220 Preemptive 0000000000000000:0000000000000000 00000277e4653c40 0 MTA (Threadpool Worker)87 59 47e0 000002778373c310 1029220 Preemptive 0000000000000000:0000000000000000 00000277e4653c40 0 MTA (Threadpool Worker)XXXX 57 0 000002778351ee50 1039820 Preemptive 0000000000000000:0000000000000000 00000277e4653c40 0 Ukn (Threadpool Worker)89 50 2dbc 000002778351e680 8029220 Preemptive 0000000000000000:0000000000000000 00000277e4653c40 0 MTA (Threadpool Completion Port)
可以看到84号线程有异常信息
System.Reflection.TargetInvocationException 00000277e781ef80
通过指令 !PrintException d IP,可以查看到具体的信息内容以及查询调用的层层嵌套,如下
0:000> !PrintException d 00000277e781ef80Exception object: 00000277e781ef80Exception type: System.Reflection.TargetInvocationExceptionMessage: 调用的目标发生了异常。InnerException: System.AccessViolationException, Use !PrintException 00000277e781d770 to see more.StackTrace (generated):SP IP Function000000A1BB9FE350 0000000000000000 mscorlib_ni!System.RuntimeMethodHandle.InvokeMethod(System.Object, System.Object[], System.Signature, Boolean)+0xffff80028b28d240000000A1BB9FE350 00007FFD73CBD90D mscorlib_ni!System.Reflection.RuntimeMethodInfo.UnsafeInvokeInternal(System.Object, System.Object[], System.Object[])+0x10d000000A1BB9FE3C0 00007FFD73CD51F2 mscorlib_ni!System.Reflection.RuntimeMethodInfo.Invoke(System.Object, System.Reflection.BindingFlags, System.Reflection.Binder, System.Object[], System.Globalization.CultureInfo)+0x92000000A1BB9FE440 00007FFD73D54962 mscorlib_ni!System.Reflection.MethodBase.Invoke(System.Object, System.Object[])+0x22000000A1BB9FE480 00007FFD15D8DF20 DT_Capture!ModuleCapture.DT.yD6kgsJ3o(Int32, System.String, System.Object[])+0x1e0000000A1BB9FE5E0 00007FFD1662EEB0 DT_Capture!ModuleCapture.DT.Play(Int32)+0x70000000A1BB9FE6C0 00007FFD16630268 ModuleCapture!ModuleCapture.ModuleMgr.CaptureToBmpRGB(Int32, Int32, System.Drawing.Bitmap ByRef)+0x3d8000000A1BB9FE960 00007FFD16633E65 ModelShowCtr!ModelShowCtrNameSpace.ModleShowCtr+<>c__DisplayClass40_0.<RunA>b__0()+0x2c5000000A1BB9FEC20 00007FFD73D1AF27 mscorlib_ni!System.Threading.Tasks.Task.Execute()+0x47000000A1BB9FEC60 00007FFD73CADF12 mscorlib_ni!System.Threading.ExecutionContext.RunInternal(System.Threading.ExecutionContext, System.Threading.ContextCallback, System.Object, Boolean)+0x172000000A1BB9FED30 00007FFD73CADD95 mscorlib_ni!System.Threading.ExecutionContext.Run(System.Threading.ExecutionContext, System.Threading.ContextCallback, System.Object, Boolean)+0x15000000A1BB9FED60 00007FFD73D1B1E1 mscorlib_ni!System.Threading.Tasks.Task.ExecuteWithThreadLocal(System.Threading.Tasks.Task ByRef)+0x231000000A1BB9FEE10 00007FFD73D1A8C1 mscorlib_ni!System.Threading.Tasks.Task.ExecuteEntry(Boolean)+0xa1000000A1BB9FEE50 00007FFD73C78E46 mscorlib_ni!System.Threading.ThreadPoolWorkQueue.Dispatch()+0x156
有细心的网友可能发现,这里面还有一则重要信息
InnerException: System.AccessViolationException, Use !PrintException 00000277e781d770 to see more.
我们通过这里提示的IP 00000277e781d770,我们可以深挖更加详细的信息,具体如下
0:000> !PrintException d 00000277e781d770Exception object: 00000277e781d770Exception type: System.AccessViolationExceptionMessage: 尝试读取或写入受保护的内存。这通常指示其他内存已损坏。InnerException: <none>StackTrace (generated):SP IP Function000000A1BB9FDB40 0000000000000001 CliDll!<Module>.cls.Play2(cls*)+0x2000000A1BB9FDC20 00007FFD1662F13F CliDll!CliDll.CamDevice.Play()+0x4fStackTraceString: <none>HResult: 80004003
到此,我们已经知道了具体是哪个模块,哪个函数出现的问题,那么对于问题的解决就简单多了。
看到这里,网友可能会问,我不通过!t去看所有线程情况的方式去看异常堆栈,可以实现吗?是可以的。
技巧2,通过如下指令
0:000> !dumpheap -type Exception -statStatistics:MT Count TotalSize Class Name00007ffd737c8e78 1 24 System.Text.DecoderExceptionFallback00007ffd737c8e00 1 24 System.Text.EncoderExceptionFallback00007ffd15becd10 1 24 Unity.Exceptions.IRequiresRecovery[]00007ffd737c6d60 1 64 System.UnhandledExceptionEventHandler00007ffd72b17da0 1 64 System.Threading.ThreadExceptionEventHandler00007ffd737c6618 1 160 System.Reflection.TargetInvocationException00007ffd73745cf8 1 160 System.ExecutionEngineException00007ffd73745c80 1 160 System.StackOverflowException00007ffd73745c08 1 160 System.OutOfMemoryException00007ffd73745b70 1 160 System.Exception00007ffd737c8268 1 176 System.AccessViolationException00007ffd73745d70 2 320 System.Threading.ThreadAbortException00007ffd737c9a30 1635 261600 System.Threading.WaitHandleCannotBeOpenedExceptionTotal 1648 objects
在这里,我们继续以刚刚上文展示的 System.AccessViolationException异常为例子,此时的IP是00007ffd737c8268 ,我们通过以下指令可以查得到具体信息
0:000> !DumpHeap /d -mt 00007ffd737c8268Address MT Size00000277e781d770 00007ffd737c8268 176Statistics:MT Count TotalSize Class Name00007ffd737c8268 1 176 System.AccessViolationExceptionTotal 1 objects
上面提供了一个重要的IP:00000277e781d770,我想你看到这里,看到也知道是和上面的一致,此时你只需要用!PrintException /d IP的方式也可以看到详细内容,这里就不再次显示。
好了,今天的分享就先到这里,如果你也对dump文件分析感兴趣,或者也有软件闪退、卡死、内存增加等软件问题,可以后台留言,我们一起交流学习!
