


prometheus中文翻译过来为"普罗米修斯",希腊神话人物,是最具智慧的神明之一,他创造了人类,保护人类,并教会人类知识和技能。而这款工具是启发于google的Brogmon系统,从2012年至今也经历了将近8个年头,且在2016年继Kubernetes后成为第二个从CNCF(云原生基金会)的毕业项目,可见其实力有多强。
关于CNCF基金会,这里简单介绍一下,其属于Linux基金会,所有代码贡献者将承担 Apache 贡献者许可协议中规定的义务。想具体了解可在简书上搜《想了解 CNCF 云原声基金会?看这篇就行了!》
一、prometheus架构图
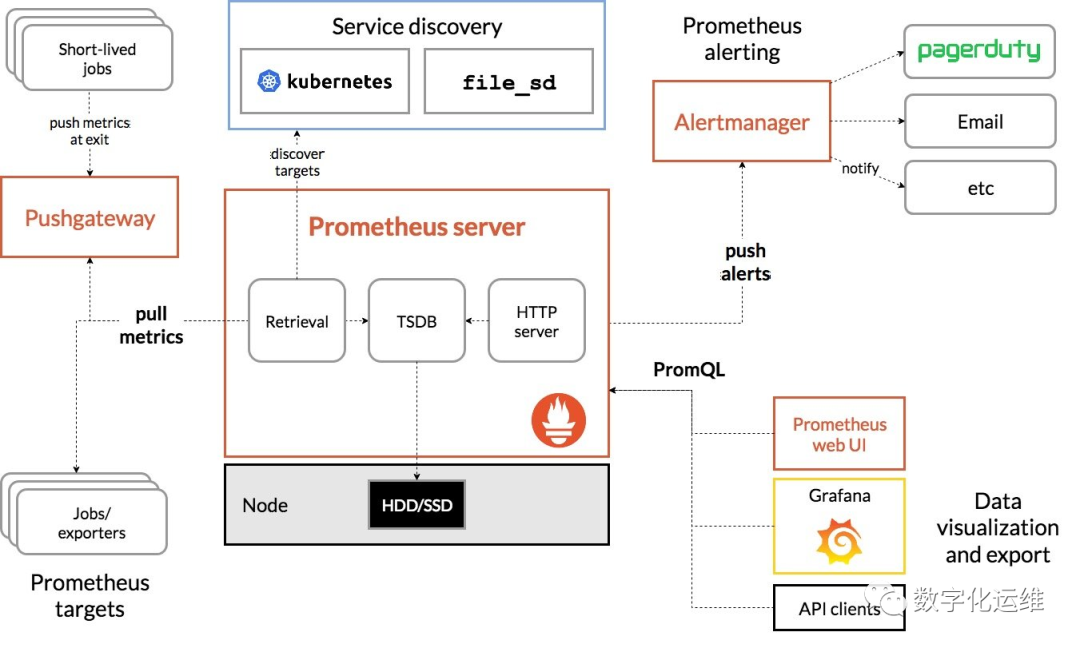
对于刚刚接触这个工具的我们来说,看着还是有点乱,整体梳理一下,图包含主要几大部分:
Prometheus server,普罗米修斯服务端
Retrieval,拉去监控目标端信息
PromQL,普罗米修斯查询语言,查TSDB数据,通过UI进行数据可视化展现。
push alerts,推送告警服务
Prometheus server
官网下载https://prometheus.io,整个网站没有中文版,在github上有专业的朋友Ryan Yang进行了翻译,非常感谢,在这里也提供地址https://prometheus.fuckcloudnative.io。
二、安装
tar xvfz prometheus-*.tar.gz
cd prometheus-*
进入解压目录,找到配置文件prometheus.yml。
global:
  scrape_interval:     15s # By default, scrape targets every 15 seconds.

  # Attach these labels to any time series or alerts when communicating with
  # external systems (federation, remote storage, Alertmanager).
  external_labels:
    monitor: 'codelab-monitor'

# A scrape configuration containing exactly one endpoint to scrape:
# Here it's Prometheus itself.
scrape_configs:
  # The job name is added as a label `job=<job_name>` to any timeseries scraped from this config.
  - job_name: 'prometheus'

    # Override the global default and scrape targets from this job every 5 seconds.
    scrape_interval: 5s

    static_configs:
      - targets: ['localhost:9090']
这里需要注意,如果想远程访问的话,将localhost改为具体的安装服务器IP地址。其他的参数可以先不用管。
三、启动prometheus服务
# Start Prometheus.
# By default, Prometheus stores its database in ./data (flag --storage.tsdb.path).
./prometheus --config.file=prometheus.yml
不加--config.file=prometheus.yml也会去此目录寻找配置文件。
四、浏览器输入http:///<your ip >:9090
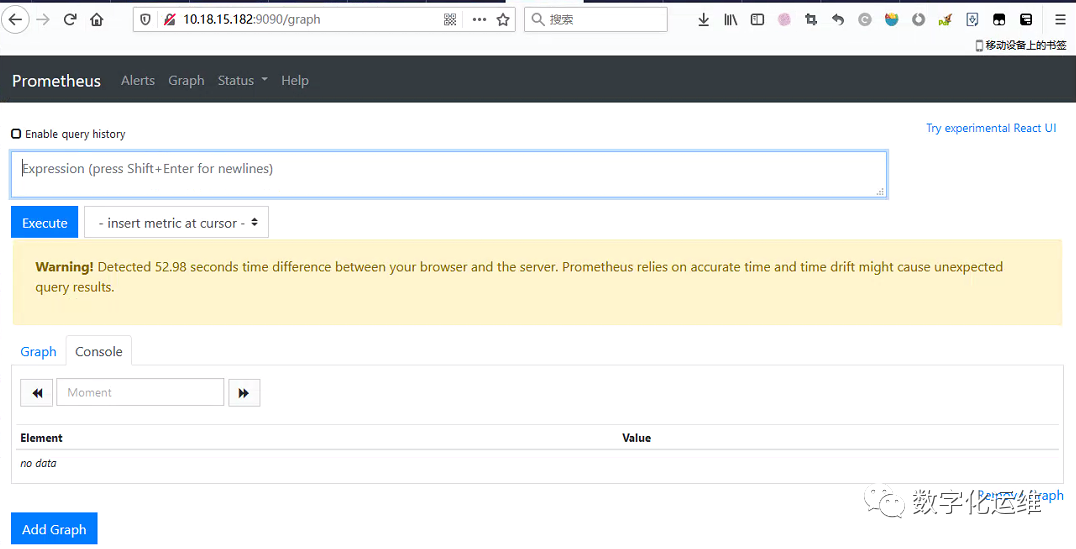
这样,prometheus就正常安装好了

以上是为了简便,均是采用root来安装运行的,实际生产,还是要使用普通用户来进行安装管理。
默认约定使用prometheus作为属组和用户
默认约定安装二进制文件位置(linux环境)在/usr/local/bin/下
一、系统service方式
RHEL7/CentOS7
[Unit]
Description=Prometheus
Wants=network-online.target
After=network-online.target

[Service]
User=prometheus
Group=prometheus
Type=simple
ExecStart=/usr/local/bin/prometheus \
    --config.file /etc/prometheus/prometheus.yml \
    --storage.tsdb.path /var/lib/prometheus/ \
    --web.console.templates=/etc/prometheus/consoles \
    --web.console.libraries=/etc/prometheus/console_libraries

[Install]
WantedBy=multi-user.target
添加系统服务
systemctl enable prometheus
启动服务
systemctl start prometheus
RHEL6/CentOS6
vi /etc/rc.d/init.d/prometheus
#!/bin/bash
#
# /etc/rc.d/init.d/prometheus
#
#  Prometheus Server
#
#  description: Prometheus Server
#  processname: prometheus

# Source function library.
. /etc/rc.d/init.d/functions

#chkconfig: - 85 15
#description: for Prometheus server.

PROGNAME=prometheus
PROG=/usr/local/bin/$PROGNAME
USER=prometheus
LOGFILE=/data/prometheus.log
LOCKFILE=/var/run/$PROGNAME.pid

start() {
    echo -n "Starting $PROGNAME: "
    cd /usr/local/bin/
    daemon --user $USER --pidfile="$LOCKFILE" "$PROG &>$LOGFILE &"
    echo $(pidofproc $PROGNAME) >$LOCKFILE
    echo
}

stop() {
    echo -n "Shutting down $PROGNAME: "
    killproc $PROGNAME
    rm -f $LOCKFILE
    echo
}


case "$1" in
    start)
    start
    ;;
    stop)
    stop
    ;;
    status)
    status $PROGNAME
    ;;
    restart)
    stop
    start
    ;;
    reload)
    echo "Sending SIGHUP to $PROGNAME"
    kill -SIGHUP $(pidofproc $PROGNAME)#!/bin/bash
    ;;
    *)
        echo "Usage: service prometheus {start|stop|status|reload|restart}"
        exit 1
    ;;
esac
权限修改
chmod 755 /etc/rc.d/init.d/prometheus
添加系统服务
chkconfig --level 35 prometheus on
启动服务
/etc/rc.d/init.d/prometheus start
or
service start  prometheus
二、supervisor方式
这种方法,其实也不错,通过python安装,python2,3都可以,经过尝试,比如redis等需要带密码参数的情况,参数直接被忽略了,导致无法正常监控软件。其他情况是没有问题的,而且通过supervisor web访问集中管理,也是非常方便的。以后有机会再深入研究。
