


1、登陆opengauss
[root@enmoedu ~]# su - omm
Last login: Sun Dec 11 16:17:18 CST 2022 on pts/2
[omm@enmoedu ~]$ gs_om -t status --detail
[   Cluster State   ]

cluster_state   : Normal
redistributing  : No
current_az      : AZ_ALL

[  Datanode State   ]

    node   node_ip         port      instance                            state
----------------------------------------------------------------------------------------------
1  enmoedu 192.168.94.135  15400      6001 /opt/huawei/install/data/dn   P Primary Normal
[omm@enmoedu ~]$ gsql -d postgres -p 15400 -r
gsql ((openGauss 3.0.0 build 02c14696) compiled at 2022-04-01 18:12:34 commit 0 last mr  )
Non-SSL connection (SSL connection is recommended when requiring high-security)
Type "help" for help.

openGauss=#
2、操作系统命令查看实例状态
[root@enmoedu ~]# su - omm
Last login: Mon Dec 12 00:25:57 CST 2022 on pts/0
[omm@enmoedu ~]$ ps -ef|grep gaussdb
omm        2127      1  5 Dec11 ?        00:44:21 /opt/huawei/install/app/bin/gaussdb -D /opt/huawei/install/data/dn
omm       39892  39843  0 00:28 pts/1    00:00:00 grep --color=auto gaussdb
[omm@enmoedu ~]$
[omm@enmoedu ~]$ ps -Tp 1
   PID   SPID TTY          TIME CMD
     1      1 ?        00:00:12 systemd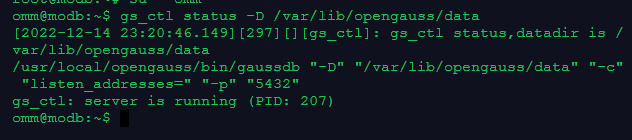
[omm@enmoedu ~]$3、使用数据库工具gs_ctl查看实例状态
gs_ctl status -D 路径比如:
4、检查参数
show data_directory;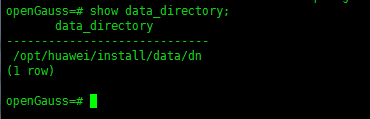
[omm@enmoedu ~]$ gs_ctl status -D /opt/huawei/install/data/dn
[2022-12-12 00:41:01.557][40649][][gs_ctl]: gs_ctl status,datadir is /opt/huawei/install/data/dn
gs_ctl: server is running (PID: 2127)
/opt/huawei/install/app/bin/gaussdb "-D" "/opt/huawei/install/data/dn"
[omm@enmoedu ~]$ 5、检查锁信息
锁机制是数据库保证数据一致性的重要手段,检查相关信息可以检查数据库的事务和运行状况。
5.1)查询数据库中的锁信息
select * from pg_locks;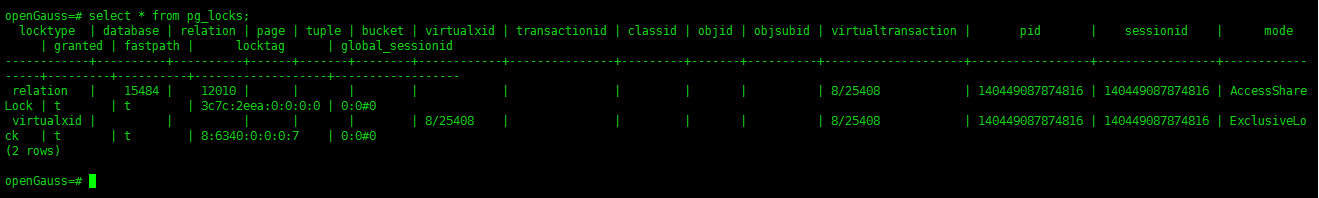
5.2)查询等待锁的线程状态信息
select * from pg_thread_wait_status where wait_status='acquire_lock';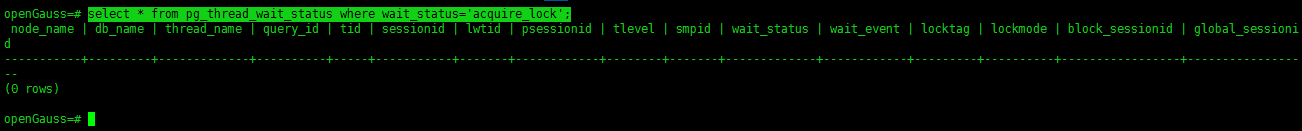
6、统计事件数据
SQL语句长时间运行会占用大量系统资源,用户可以通过查看事件发生的时间,占用内存大小来了解现在数据库运行状态。
6.1)查询事件的时间,查询事件的线程启动时间、事务启动时间、SQL启动时间以及状态变更时间。
select backend_start,xact_start,query_start,state_change from pg_stat_activity;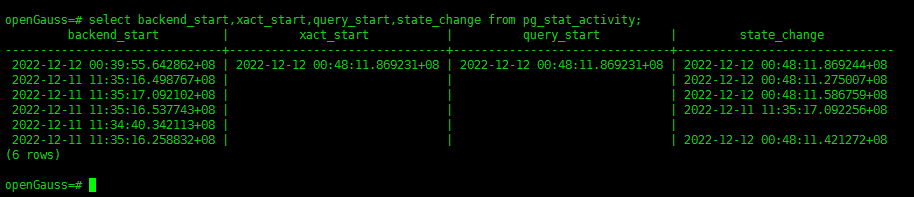
6.2)查询当前服务器的会话计数信息。
select count(*) from pg_stat_activity;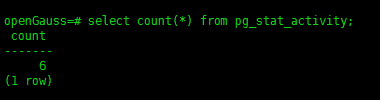
6.3)查询系统级统计信息,查询当前使用内存最多的会话信息。
select * from pv_session_memory_detail() order by usedsize desc limit 10;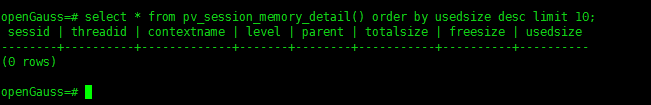
6.4)查询表统计信息。
select * from pg_statistic;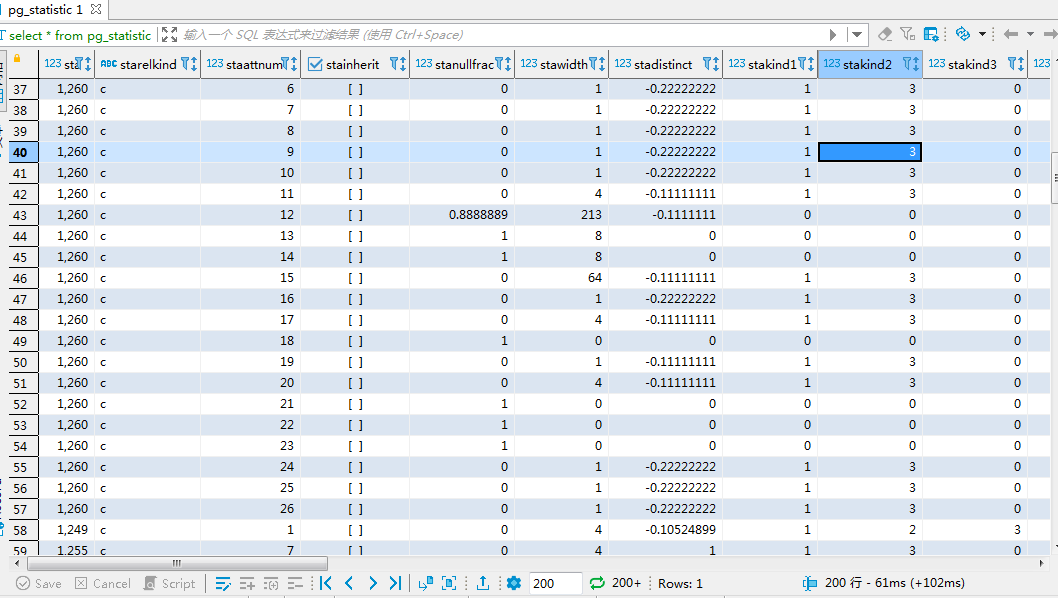
查看pg_statistic的表结构
openGauss=# \d pg_statistic
   Table "pg_catalog.pg_statistic"
    Column     |   Type   | Modifiers
---------------+----------+-----------
 starelid      | oid      | not null
 starelkind    | "char"   | not null
 staattnum     | smallint | not null
 stainherit    | boolean  | not null
 stanullfrac   | real     | not null
 stawidth      | integer  | not null
 stadistinct   | real     | not null
 stakind1      | smallint | not null
 stakind2      | smallint | not null
 stakind3      | smallint | not null
 stakind4      | smallint | not null
 stakind5      | smallint | not null
 staop1        | oid      | not null
 staop2        | oid      | not null
 staop3        | oid      | not null
 staop4        | oid      | not null
 staop5        | oid      | not null
 stanumbers1   | real[]   |
 stanumbers2   | real[]   |
 stanumbers3   | real[]   |
 stanumbers4   | real[]   |
 stanumbers5   | real[]   |
 stavalues1    | anyarray |
 stavalues2    | anyarray |
 stavalues3    | anyarray |
 stavalues4    | anyarray |
 stavalues5    | anyarray |
 stadndistinct | real     |
 staextinfo    | text     |
Indexes:
    "pg_statistic_relid_kind_att_inh_index" UNIQUE, btree (starelid, starelkind, staattnum, stainherit) TABLESPACE pg_default
Replica Identity: NOTHING
7、数据库版本、日志信息
7.1)数据库版本
7.2)在gsql中查看数据库日志的位置
\! ls /var/log/omm/omm/pg_log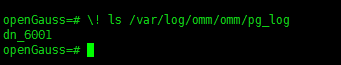
7.3)数据库存储日志的位置
查找日志位置
find / -name "pg_log" -print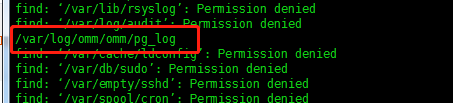
[omm@enmoedu ~]$ cd /var/log/omm/omm/pg_log
[omm@enmoedu pg_log]$ ls
dn_6001
[omm@enmoedu pg_log]$ cd dn_6001/
[omm@enmoedu dn_6001]$ ll
total 13324
-rw------- 1 omm dbgrp   82879 Nov 28 03:57 postgresql-2022-11-28_030948.log
-rw------- 1 omm dbgrp  167333 Nov 28 23:59 postgresql-2022-11-28_223411.log
-rw------- 1 omm dbgrp  315615 Nov 29 03:18 postgresql-2022-11-29_000000.log
-rw------- 1 omm dbgrp  614574 Nov 29 23:59 postgresql-2022-11-29_174354.log
-rw------- 1 omm dbgrp  325256 Nov 30 03:24 postgresql-2022-11-30_000000.log
-rw------- 1 omm dbgrp  278050 Dec  1 04:14 postgresql-2022-12-01_013723.log
-rw------- 1 omm dbgrp 1130621 Dec  1 23:59 postgresql-2022-12-01_120331.log
-rw------- 1 omm dbgrp  274071 Dec  2 02:59 postgresql-2022-12-02_000000.log
-rw------- 1 omm dbgrp  377651 Dec  2 15:26 postgresql-2022-12-02_115731.log
-rw------- 1 omm dbgrp  290146 Dec  3 13:54 postgresql-2022-12-03_112155.log
-rw------- 1 omm dbgrp  463732 Dec  4 14:39 postgresql-2022-12-04_103414.log
-rw------- 1 omm dbgrp  685283 Dec  5 10:14 postgresql-2022-12-05_032152.log
-rw------- 1 omm dbgrp  575375 Dec  6 23:59 postgresql-2022-12-06_181910.log
-rw------- 1 omm dbgrp  254507 Dec  7 02:36 postgresql-2022-12-07_000000.log
-rw------- 1 omm dbgrp  468164 Dec  7 23:59 postgresql-2022-12-07_192649.log
-rw------- 1 omm dbgrp  259943 Dec  8 02:38 postgresql-2022-12-08_000000.log
-rw------- 1 omm dbgrp   72872 Dec  8 23:59 postgresql-2022-12-08_232724.log
-rw------- 1 omm dbgrp  400181 Dec  9 04:06 postgresql-2022-12-09_000000.log
-rw------- 1 omm dbgrp 1376356 Dec 10 15:00 postgresql-2022-12-10_010658.log
-rw------- 1 omm dbgrp 1279191 Dec 11 23:59 postgresql-2022-12-11_113337.log
-rw------- 1 omm dbgrp  114600 Dec 12 01:06 postgresql-2022-12-12_000000.log
[omm@enmoedu dn_6001]$或者,ls /var/lib/opengauss/data/pg_log 也可以。
8、检查应用连接数
如果应用程序与数据库的连接数超过最大值,则新的连接无法建立。建议每天检查连接数,及时释放空闲的连接或者增加最大连接数。
8.1)执行如下SQL语句查看连接数
select count(*) from (select pg_stat_get_backend_idset() as backendid) as result;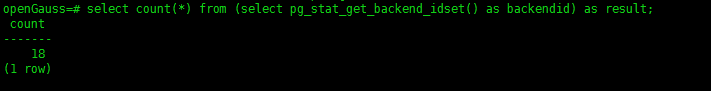
8.2)看现有最大连接数
show max_connections;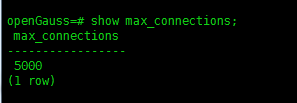
9、例行维护表:VACUUM、VACUUM FULL和ANALYZE
为了保证数据库的有效运行,数据库必须在插入/删除操作后,基于客户场景,定期做VACUUM FULL和ANALYZE,更新统计信息,以便获得更优的性能。
VACUUM和ANALYZE会导致I/O流量的大幅增加,这可能会影响其他活动会话的性能
9.1)创建表、插入数据、查看数据
建表
CREATE TABLE customer_t
(c_customer_sk             integer,
 c_customer_id             char(5),
 c_first_name              char(6),
 c_last_name               char(8)
) ;
插数
insert into customer_t (c_customer_sk, c_customer_id, c_first_name,c_last_name) values
(6885, 1, 'joes', 'hunter'),
(4321, 2, 'lily','carter'),
(9527, 3, 'james', 'cook'),
(9500, 4, 'lucy', 'baker');
select count(*) from customer_t;
查数
select * from customer_t;使用VACUUM或VACUUM FULL命令,进行磁盘空间回收。
- 使用VACUUM。
vacuum customer_t;- 使用VACUUM full:需要向正在执行的表增加排他锁,且需要停止其他所有数据库操作。
vacuum full customer_t;- 使用ANALYZE语句更新统计信息。
analyze customer_t;- 使用ANALYZE VERBOSE语句更新统计信息,并输出表的相关信息。
analyze verbose customer_t;- 也可以同时执行vacuum analyze命令进行查询优化。
vacuum analyze customer_t;维护建议:1)定期对部分大表做vacuum full,在性能下降后为全库做vacuum full,目前暂定每月做一次vacuum full。
2)定期对系统表做vacuum full,主要是pg_attribute。
3)启用系统自动清理线程(autovacuum)自动执行vacuum和analyze,回收被标识为删除状态的记录空间,并更新表的统计数据。
9、重建索引
在重建索引前,用户可以通过临时增大maintenance_work_mem和psort_work_mem的取值来加快索引的重建。
9.1)环境准备。
openGauss=# create tablespace exam relative location 'tablespace1/tablespace_1';
CREATE TABLESPACE
openGauss=# create schema hr;
CREATE SCHEMA
openGauss=# create table hr.areas(area_id number, area_name varchar2(25) ) tablespace exam ;
CREATE TABLE
openGauss=# \d hr.areas
               Table "hr.areas"
  Column   |         Type          | Modifiers
-----------+-----------------------+-----------
 area_id   | numeric               |
 area_name | character varying(25) |
Tablespace: "exam"

openGauss=# create index areas_idx on hr.areas (area_id) ;
CREATE INDEX
openGauss=# 9.2)使用reindex table语句重建索引。
openGauss=# reindex table hr.areas;
REINDEX
openGauss=# 