



SuperBenchmarker。一款贼好用超级简单轻便的压测工具。
以前,为了做一些压力测试,第一反应就是jmeter。但是在日常开发中,我们只是需要简单地进行一下测试,没必要搞这么庞大的工具来进行操作,而且使用起来也太繁琐了。后面有好友推荐了一下SuperBenchmarker,发现这个工具真是太方便了,直接通过命令行的方式就能进行操作。
工具源码地址:https://github.com/aliostad/SuperBenchmarker。有需求的朋友可以自己拉下来研究研究。运行工具在download文件夹下,下载下来进行简单的配置就能直接运行。具体安装方法就不赘述了,可以自己去上面提供的地址去看看,都有详细的介绍。
贴下主要命令参数介绍:
| 参数 | 描述 |
| -c, --concurrency | (Default: 1) Number of concurrent requests |
| -n, --numberOfRequests | (Default: 100) Total number of requests |
| -N, --numberOfSeconds | Number of seconds to run the test. If specified, -n will be ignored. |
| -y, --delayInMillisecond | (Default: 0) Delay in millisecond |
| -u, --url | Required. Target URL to call. Can include placeholders. |
| -m, --method | (Default: GET) HTTP Method to use |
| -t, --template | Path to request template to use |
| -l, --logfile | Path to the log file storing run stats |
| -f, --file | Path to CSV file providing replacement values for the test |
| -a, --TSV | If you provide a tab-separated-file (TSV) with -f option instead of CSV |
| -d, --dryRun | Runs a single dry run request to make sure all is good |
| -e, --timedField | Designates a datetime field in data. If set, requests will be sent according to order and timing of records. |
| -v, --verbose | Provides verbose tracing information |
| -b, --tokeniseBody | Tokenise the body |
| -k, --cookies | Outputs cookies |
| -x, --useProxy | Whether to use default browser proxy. Useful for seeing request/response in Fiddler. |
| -q, --onlyRequest | In a dry-run (debug) mode shows only the request. |
| -h, --headers | Displays headers for request and response. |
| -z, --saveResponses | saves responses in -w parameter or if not provided in\response_<timestamp> |
| -w, --responsesFolder | folder to save responses in if and only if -w parameter is set |
| -?, --help | Displays this help. |
| -C, --dontcap | Don't Cap to 50 characters when Logging parameters |
| -R, --responseregex | Regex to extract from response. If it has groups, it retrieves the last group. |
| -j, --jsonCount | Captures number of elements under the path e.g. root/leaf1/leaf2 finds count of leaf2 children - stores in the log as another parameter |
| -W, --warmUpPeriod | (Default: 0) Number of seconds to gradually increase number of concurrent users. Warm-up calls do not affect stats. |
| -P, --reportSliceSeconds | (Default: 3) Number of seconds as interval for reporting slices. E.g. if chosen as 5,report charts have 5 second intervals. |
| -F, --reportFolder | Name of the folder where report files get stored. By default it is in yyyy-MM-dd_HH-mm-ss.ffffff of the start time. |
| -B, --dontBrowseToReports | By default it, sb opens the browser with the report of the running test. If specified, it wil not browse. |
| -U, --shuffleData | If specified, shuffles the dataset provided by -f option. |
| --help | Display this help screen. |
下面我们来进行一些简单的示例操作吧。
注意:我这里使用的操作环境是Windows
简单访问地址
sb -u "http://127.0.0.1:8080/demo/get"
验证请求是否正常,查看响应信息
sb -u "http://127.0.0.1:8080/demo/get?message=hello" -d
10个并发,总共请求100次数
sb -u "http://127.0.0.1:8080/demo/get" -c 10 -n 100
10个并发,总共请求耗时60秒
sb -u "http://127.0.0.1:8080/demo/get" -c 10 -N 60
10个并发,总共请求耗时60秒,每次请求延迟 1秒
sb -u "http://127.0.0.1:8080/demo/get" -c 10 -N 60 -y 1000
请求post接口,携带头部参数及body内容
sb-post.txt内容:
token:token_messageContent-Type: application/json{"page":1,"size":2000}
执行命令:
sb -u "http://127.0.0.1:8080/demo/post" -m POST -t C:\Users\layne\Desktop\sb-post.txt -d
输出每个请求的响应时间到指定文件
sb -u "http://127.0.0.1:8080/demo/post" -m POST -t C:\Users\layneliu\Desktop\sb-post.txt -c 10 -N 10 -l C:\Users\layneliu\Desktop\sb-post-log.txt
输出内容:
响应时间 | 请求索引 | 返回HTTP状态码 | 响应耗时
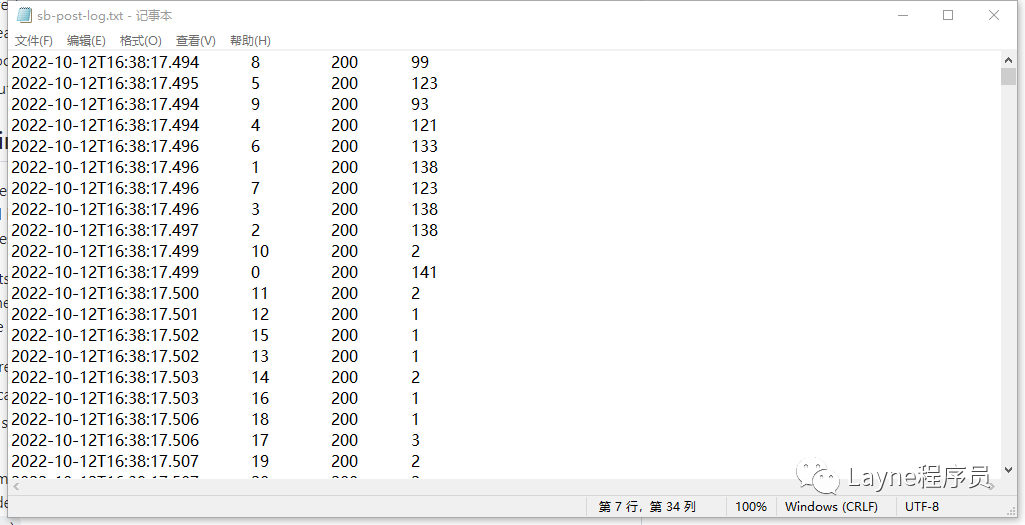
部分请求示例截图:
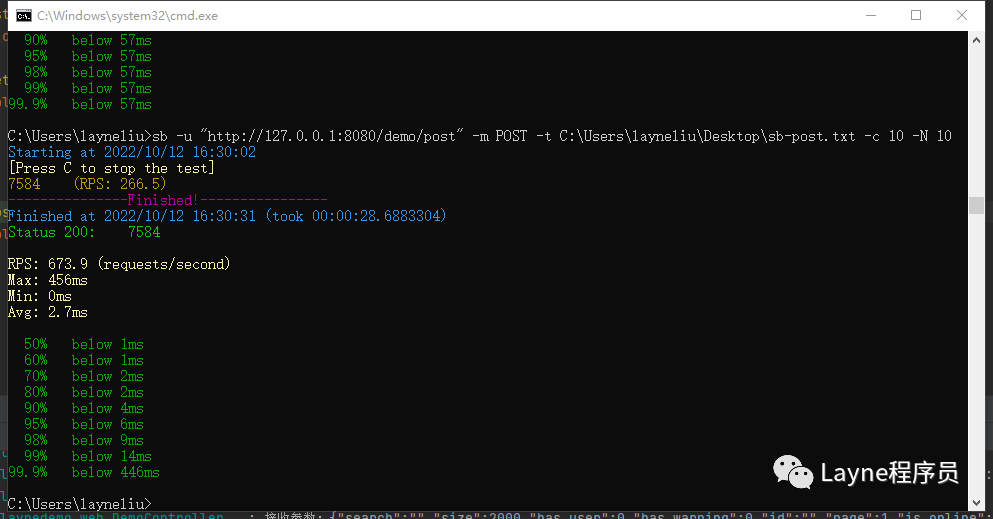
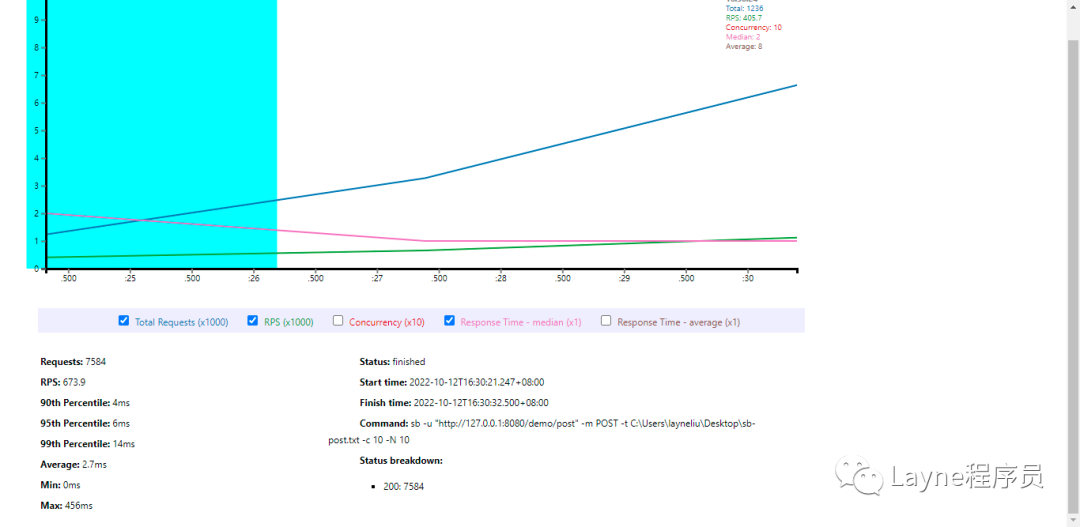
根据相关返回结果描述,我们可以看到相应接口的一些性能指标。这样很方便地能知道接口的性能。
好啦,介绍就到这里啦,更多功能可以去上面提供的源码地址去仔细看看。
