
GUIDE
导读
接下将带领读者探秘Prometheus的自定义查询语言PromQL。通过PromQL用户可以非常方便地对监控样本数据进行统计分析,PromQL支持常见的运算操作符,同时PromQL中还提供了大量的内置函数可以实现对数据的高级处理。当然在学习PromQL之前,用户还需要了解Prometheus的样本数据模型。PromQL作为Prometheus的核心能力除了实现数据的对外查询和展现,同时告警监控也是依赖PromQL实现的。

理解时间序列
# HELP go_goroutines Number of goroutines that currently exist.# TYPE go_goroutines gaugego_goroutines 7# HELP go_info Information about the Go environment.# TYPE go_info gaugego_info{version="go1.18.3"} 1
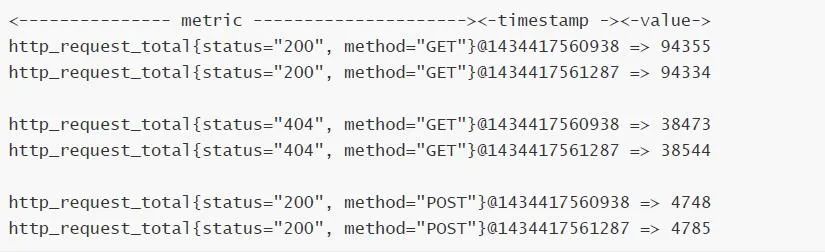
Prometheus会将所有采集到的样本数据以时间序列(time-series)的方式保存在内存数据库中,并且定时保存到硬盘上。time-series是按照时间戳和值的序列顺序存放的,我们称之为向量(vector). 每条time-series通过指标名称(metrics name)和一组标签集(labelset)命名。如下所示,可以将time-series理解为一个以时间为Y轴的数字矩阵:
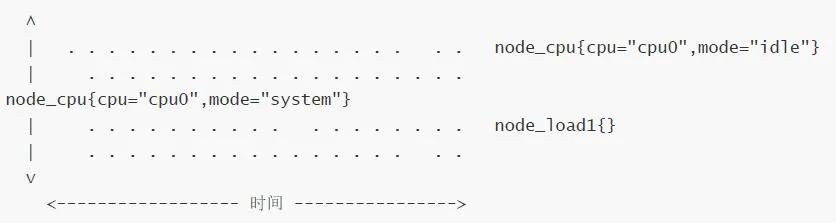
指标(metric):metric name和描述当前样本特征的labelsets;
时间戳(timestamp):一个精确到毫秒的时间戳;
样本值(value):一个float64的浮点型数据表示当前样本的值;
<metric name>{<label name>=<label value>, ...}
api_http_requests_total{method="POST", handler="/messages"}
等同于:
{__name__="api_http_requests_total",method="POST", handler="/messages"}
在Prometheus源码中也可以指标(Metric)对应的数据结构,如下所示:
type Metric LabelSettype LabelSet map[LabelName]LabelValuetype LabelName stringtype LabelValue string
Metrics类型


在Exporter返回的样本数据中,其注释中也包含了该样本的类型。例如:
# TYPE container_cpu_load_average_10s gaugecontainer_cpu_load_average_10s{container_label_maintainer="",container_label_org_opencontainers_image_created="",container_label_org_opencontainers_image_revision="",container_label_org_opencontainers_image_source="",container_label_org_opencontainers_image_url="",id="/",image="",name=""} 0
01
Counter:只增不减的计数器
rate(http_requests_total[5m])
查询当前系统中,访问量前10的HTTP地址:
topk(10, http_requests_total)
02
Gauge:可增可减的仪表盘
node_memory_MemFree
delta(cpu_temp_celsius{host="zeus"}[2h])
predict_linear(node_filesystem_free{job="node"}[1h], 4 * 3600)
使用Histogram和Summary分析数据分布情况:

# HELP prometheus_tsdb_wal_fsync_duration_seconds Duration of WAL fsync.# TYPE prometheus_tsdb_wal_fsync_duration_seconds summaryprometheus_tsdb_wal_fsync_duration_seconds{quantile="0.5"} 0.012352463prometheus_tsdb_wal_fsync_duration_seconds{quantile="0.9"} 0.014458005prometheus_tsdb_wal_fsync_duration_seconds{quantile="0.99"} 0.017316173prometheus_tsdb_wal_fsync_duration_seconds_sum 2.888716127000002prometheus_tsdb_wal_fsync_duration_seconds_count 216
# HELP prometheus_tsdb_compaction_chunk_range Final time range of chunks on theirfirst compaction# TYPE prometheus_tsdb_compaction_chunk_range histogramprometheus_tsdb_compaction_chunk_range_bucket{le="100"} 0prometheus_tsdb_compaction_chunk_range_bucket{le="400"} 0prometheus_tsdb_compaction_chunk_range_bucket{le="1600"} 0prometheus_tsdb_compaction_chunk_range_bucket{le="6400"} 0
往/期/回/顾
性能监控基石Prometheus(普罗米修斯)核心组件
-End-
「有用就扩散」
「有用就点在看」
更多课程咨询或免费资料领取,扫下方二维码即可!