2022-12-27 29 山东删除编辑
简介: 使用obd安装配置grafana监控现有的ob数据库
下载oceanbase4.0 all in one并安装之后,grafana、prometheus及obagent都已经安装了,可以使用obd工具部署并启动grafana对现有的oceanbase进行监控,部署的步骤十分简单,只需要编辑一个配置文件,然后使用obd cluster命令部署并启动即可。配置文件可以使用obd的示例文件里的all-components-min.yaml,在这个文件的基础上根据ob数据库和服务器的实际情况稍微更改一下即可。
1 拷贝并修改配置文件
[root@my_ob example]# pwd
      /usr/local/oceanbase-all-in-one/obd/usr/obd/example
obd的配置文件示例在上面的目录下,拷贝这个目录下面的all-components-min.yaml至当前用户的home目录下,编辑一下这个文件,删除里面除obagent、grafana、prometheus之外的部分,根据实际情况调整文件里内容,这次部署使用的配置文件如下:
[root@localhost ~]# cat all-components-min.yaml
## Only need to configure when remote login is required
# user:
#   username: your username
#   password: your password if need
#   key_file: your ssh-key file path if need
#   port: your ssh port, default 22
#   timeout: ssh connection timeout (second), default 30
obagent:
  depends:
    - oceanbase-ce
  servers:
    - name: server1
      # Please don't use hostname, only IP can be supported
      ip: 127.0.0.1
  global:
    home_path: /root/obagent
    ob_monitor_status: active
prometheus:
  depends:
    - obagent
  servers:
    - 192.168.56.101
  global:
    home_path: /root/prometheus
grafana:
  depends:
    - prometheus
  servers:
    - 192.168.56.101
  global:
    home_path: /root/grafana
    login_password: oceanbase
由于是本地安装,不需要填入用户名和密码,数据库用的是本地loopback ip地址,Prometheus和grafana由于要从服务器外边访问,不能使用loopback地址,使用服务器的本地ip地址。
2 部署grafana
有了配置文件,就可以使用这个文件进行部署了。
[root@localhost ~]# obd cluster deploy gra -c all-components-min.yaml
      Package obagent-1.2.0-4.el7 is available.
      Package prometheus-2.37.1-10000102022110211.el7 is available.
      Package grafana-7.5.17-1 is available.
      install obagent-1.2.0 for local ok
      install prometheus-2.37.1 for local ok
      install grafana-7.5.17 for local ok
      +-----------------------------------------------------------------------------------------+
      |                                         Packages                                        |
      +------------+---------+-----------------------+------------------------------------------+
      | Repository | Version | Release               | Md5                                      |
      +------------+---------+-----------------------+------------------------------------------+
      | obagent    | 1.2.0   | 4.el7                 | 0e8f5ee68c337ea28514c9f3f820ea546227fa7e |
      | prometheus | 2.37.1  | 10000102022110211.el7 | 58913c7606f05feb01bc1c6410346e5fc31cf263 |
      | grafana    | 7.5.17  | 1                     | 1bf1f338d3a3445d8599dc6902e7aeed4de4e0d6 |
      +------------+---------+-----------------------+------------------------------------------+
      Repository integrity check ok
      Parameter check ok
      Open ssh connection x
      [ERROR] root@192.168.56.101 connect failed: No authentication methods available
部署过程中报错了,检查报错信息,是在ssh连接192.168.56.101地址时出现错误,没有验证方法可用,这里需要设置一下至192.168.56.101的免ssh登录,ob的官方文档里与设置方法,十分简单,直接拿来使用。
先创建一个密钥
[root@localhost ~]# ssh-keygen -t rsa
      Generating public/private rsa key pair.
      Enter file in which to save the key (/root/.ssh/id_rsa):
      Created directory '/root/.ssh'.
      Enter passphrase (empty for no passphrase):
      Enter same passphrase again:
      Your identification has been saved in /root/.ssh/id_rsa.
      Your public key has been saved in /root/.ssh/id_rsa.pub.
      The key fingerprint is:
      SHA256:OEcvGW+vAdQfJMC0gYVAm1N6dBL1ATGNEJS0Kd3PAMc root@localhost.localdomain
      The key's randomart image is:
      +---[RSA 2048]----+
      |   .o+@&%*o .    |
      |     B+OE*.+     |
      |    * = B o .    |
      |     + + O . .   |
      |      o S * .    |
      |       o + .     |
      |          . .    |
      |           o     |
      |          .      |
      +----[SHA256]-----+
上面的passphrase直接回车即可。创建完密钥后将密钥拷贝至目标服务器
[root@localhost ~]# ssh-copy-id  root@192.168.56.101
      /usr/bin/ssh-copy-id: INFO: Source of key(s) to be installed: "/root/.ssh/id_rsa.pub"
      The authenticity of host '192.168.56.101 (192.168.56.101)' can't be established.
      ECDSA key fingerprint is SHA256:JEQIKavuwHdQrHfuS+xMNdMjZxAms6UQypFH83dD4yk.
      ECDSA key fingerprint is MD5:8e:2d:c4:1f:66:2f:9c:e6:16:fb:b6:35:76:c3:1d:b2.
      Are you sure you want to continue connecting (yes/no)? yes
      /usr/bin/ssh-copy-id: INFO: attempting to log in with the new key(s), to filter out any that are already installed
      /usr/bin/ssh-copy-id: INFO: 1 key(s) remain to be installed -- if you are prompted now it is to install the new keys
      root@192.168.56.101's password:

      Number of key(s) added: 1

      Now try logging into the machine, with:   "ssh 'root@192.168.56.101'"
      and check to make sure that only the key(s) you wanted were added.
再进行部署,
[root@localhost ~]# obd cluster deploy gra -c all-components-min.yaml
      install obagent-1.2.0 for local ok
      install prometheus-2.37.1 for local ok
      install grafana-7.5.17 for local ok
      +-----------------------------------------------------------------------------------------+
      |                                         Packages                                        |
      +------------+---------+-----------------------+------------------------------------------+
      | Repository | Version | Release               | Md5                                      |
      +------------+---------+-----------------------+------------------------------------------+
      | obagent    | 1.2.0   | 4.el7                 | 0e8f5ee68c337ea28514c9f3f820ea546227fa7e |
      | prometheus | 2.37.1  | 10000102022110211.el7 | 58913c7606f05feb01bc1c6410346e5fc31cf263 |
      | grafana    | 7.5.17  | 1                     | 1bf1f338d3a3445d8599dc6902e7aeed4de4e0d6 |
      +------------+---------+-----------------------+------------------------------------------+
      Repository integrity check ok
      Parameter check ok
      Open ssh connection ok
      Cluster status check ok
      Initializes obagent work home ok
      Initializes prometheus work home ok
      Initializes grafana work home ok
      Remote obagent-1.2.0-4.el7-0e8f5ee68c337ea28514c9f3f820ea546227fa7e repository install ok
      Remote obagent-1.2.0-4.el7-0e8f5ee68c337ea28514c9f3f820ea546227fa7e repository lib check ok
      Remote prometheus-2.37.1-10000102022110211.el7-58913c7606f05feb01bc1c6410346e5fc31cf263 repository install ok
      Remote prometheus-2.37.1-10000102022110211.el7-58913c7606f05feb01bc1c6410346e5fc31cf263 repository lib check ok
      Remote grafana-7.5.17-1-1bf1f338d3a3445d8599dc6902e7aeed4de4e0d6 repository install ok
      Remote grafana-7.5.17-1-1bf1f338d3a3445d8599dc6902e7aeed4de4e0d6 repository lib check ok
      gra deployed
gra是部署的名字,可以看到部署成功了。
3 启动grafana
部署完之后,需要启动该部署
[root@localhost ~]# obd cluster start gra
      Get local repositories ok
      Search plugins ok
      Open ssh connection ok
      Load cluster param plugin ok
      Check before start obagent ok
      Check before start prometheus ok
      Check before start grafana ok
      Start obagent ok
      obagent program health check ok
      Start promethues ok
      prometheus program health check ok
      Connect to Prometheus ok
      Initialize cluster ok
      Start grafana ok
      grafana program health check ok
      Connect to grafana ok
      Initialize cluster ok
      +-----------------------------------------------+
      |                    obagent                    |
      +-----------+-------------+------------+--------+
      | ip        | server_port | pprof_port | status |
      +-----------+-------------+------------+--------+
      | 127.0.0.1 | 8088        | 8089       | active |
      +-----------+-------------+------------+--------+
      +-------------------------------------------------------+
      |                       prometheus                      |
      +----------------------------+------+----------+--------+
      | url                        | user | password | status |
      +----------------------------+------+----------+--------+
      | http://192.168.56.101:9090 |      |          | active |
      +----------------------------+------+----------+--------+
      +---------------------------------------------------------------------+
      |                               grafana                               |
      +----------------------------------------+-------+-----------+--------+
      | url                                    | user  | password  | status |
      +----------------------------------------+-------+-----------+--------+
      | http://192.168.56.101:3000/d/oceanbase | admin | oceanbase | active |
      +----------------------------------------+-------+-----------+--------+
      gra running
可以看到启动成功了,命令最后给出了prometheus和grafana的访问信息。这个数据库和granfana是部署再虚拟机上的,从虚拟机外访问却遇到了地址不能访问错误,原因是centos安装时默认打开防火墙服务,检查一下防火墙服务是否打开
[root@localhost ~]# systemctl status firewalld.service
      ● firewalld.service - firewalld - dynamic firewall daemon
         Loaded: loaded (/usr/lib/systemd/system/firewalld.service; enabled; vendor preset: enabled)
         Active: active (running) since Mon 2022-12-26 20:27:33 EST; 28min ago
           Docs: man:firewalld(1)
       Main PID: 695 (firewalld)
         CGroup: /system.slice/firewalld.service
                 └─695 /usr/bin/python2 -Es /usr/sbin/firewalld --nofork --nopid

      Dec 26 20:27:30 localhost.localdomain systemd[1]: Starting firewalld - dynamic firewall daemon...
      Dec 26 20:27:33 localhost.localdomain systemd[1]: Started firewalld - dynamic firewall daemon.
      Dec 26 20:27:34 localhost.localdomain firewalld[695]: WARNING: AllowZoneDrifting is enabled. This is considered a...now.
      Hint: Some lines were ellipsized, use -l to show in full.
可以看到,防火墙服务时打开的,临时关闭防火墙服务使用下面命令
[root@localhost ~]# systemctl stop firewalld.service
如果需要永久关闭防火墙服务,还需要运行下面命令
[root@localhost ~]# systemctl disable firewalld.service
Removed symlink /etc/systemd/system/multi-user.target.wants/firewalld.service.
Removed symlink /etc/systemd/system/dbus-org.fedoraproject.FirewallD1.service.
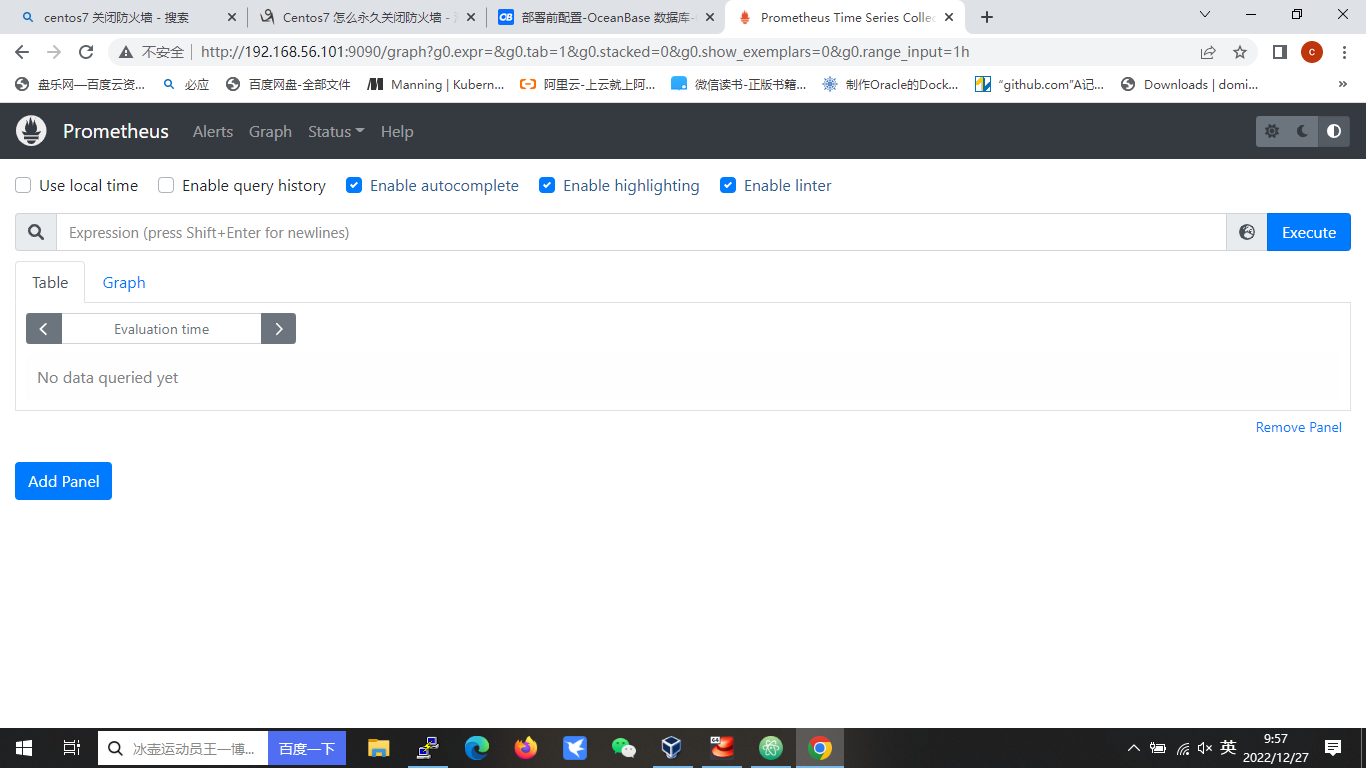
关闭防火墙服务后,从外边就可以连接到prometheus和grafana了。prometheus的界面如下
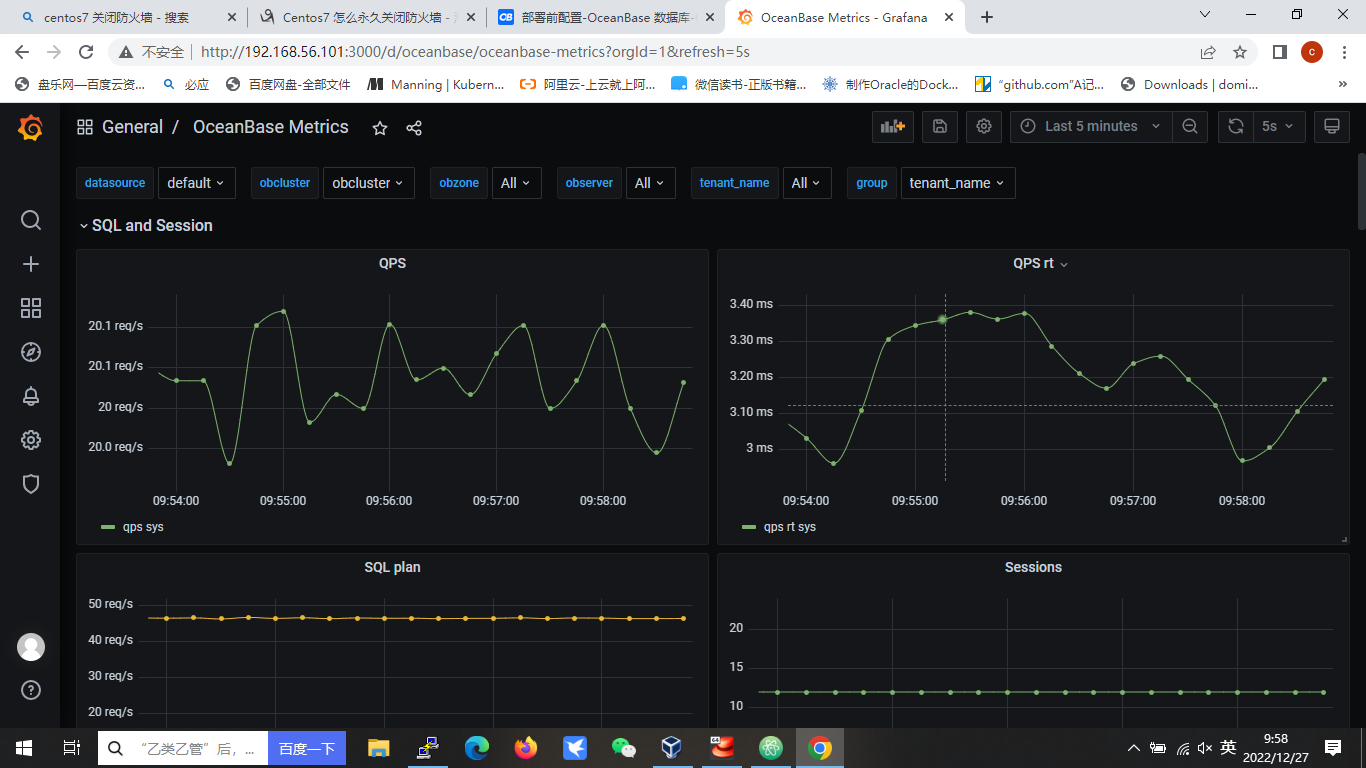
grafana 默认的用户是admin,密码是oceanbase,登录后界面是这样的