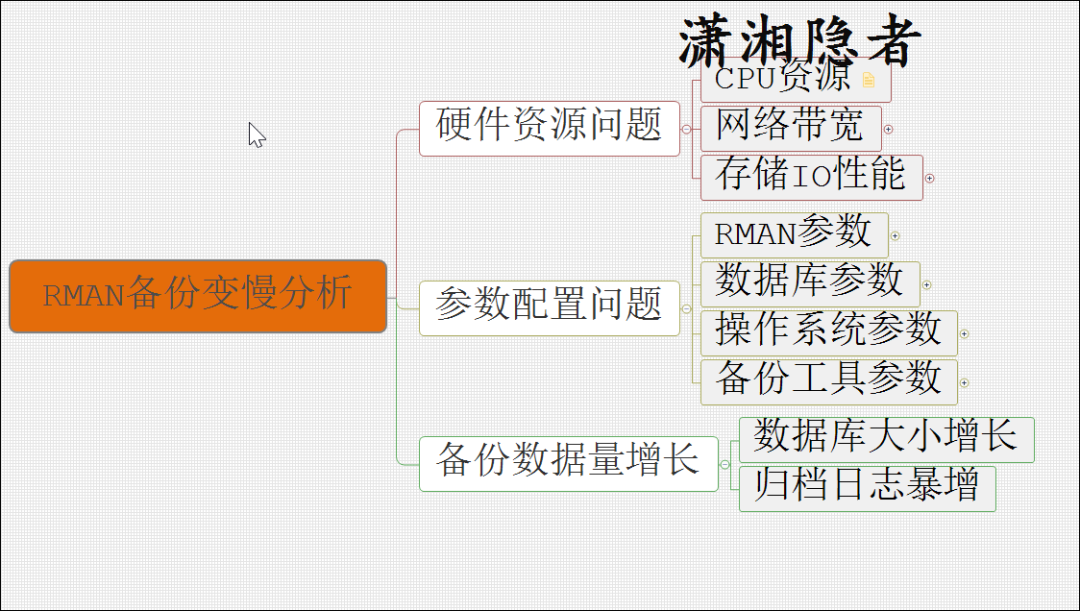
公司使用HP的备份软件Data Protector(下文简称DP)直接将Windows平台的Oracle数据库备份上带,但是最近发现一台Windows服务器上的Oracle备份作业突然从十几分钟一下子变成了耗时1个多小时的样子。一般RMAN备份变慢主要有下面一些原因:
简单检查判断后,首先排除了参数配置问题,因为这个时间范围内,RMAN的参数没有变更过,数据库参数等都没有变动过。接下来,我们检查备份数据量大小是否出现暴增,例如,表空间数据使用量是否有大幅度增长,数据库的归档日志是否出现暴增。使用下面脚本检查了数据库表空间的tablespace_usedsize增长的情况,发现只有一两个表空间有稍微增长,增长幅度非常小,所以排除数据库大小(数据使用量)增长过快引起的备份作业时间延长的因素。
set linesize 860;
set pagesize 120;
alter session set nls_date_format='yyyy-mm-dd hh24:mi:ss';
col tb_name for a16;
col ts_mb for 999,999,999.90
col max_mb for 999,999,999.90
col used_mb for 999,999,999.90
col last_mb for 999,999,999.90
col incr for 999,999.90


select * from (
  select v.name                         tb_name
        ,v.ts#
        ,s.instance_number
        ,h.tablespace_size
       * round(p.value/1024/1024,2)     ts_mb
        ,h.tablespace_maxsize
       * round(p.value/1024/1024,2)     max_mb
        ,h.tablespace_usedsize
       * round(p.value/1024/1024,2)     used_mb
        ,to_date(h.rtime, 'MM/DD/YYYY HH24:MI:SS') resize_time
        ,lag(h.tablespace_usedsize * p.value/1024/1024, 1, h.tablespace_usedsize * p.value/1024/1024)
         over (partition by v.ts# order by h.snap_id) last_mb
        ,(h.tablespace_usedsize * p.value/1024/1024)
       - lag(h.tablespace_usedsize * p.value/1024/1024, 1, h.tablespace_usedsize * p.value/1024/1024)
         over (partition by v.ts# order by h.snap_id) incr
    from dba_hist_tbspc_space_usage     h
       , dba_hist_snapshot              s
       , v$tablespace                   v
       , dba_tablespaces                t
       , v$parameter                    p
   where h.tablespace_id                = v.ts#
     and v.name                         = t.tablespace_name
     and t.contents                not in ('UNDO', 'TEMPORARY')
     and p.name                         = 'db_block_size'
     and h.snap_id                      = s.snap_id
         /* For a specific time */
     and s.begin_interval_time          > sysdate - 7
order by v.name, h.snap_id asc)
   where incr > 0;
接下来,我们检查了一下归档日志的增长情况,发现每天生成的归档日志很平稳,没有出现大的起伏波动,而且每一天生成的归档日志也较小。那么也可以排除因为归档日志暴增导致备份作业时间增长的情况
set linesize 200 pagesize 1000
column day format a3
column total format 9999
column h00 format 999
column h01 format 999
column h02 format 999
column h03 format 999
column h04 format 999
column h04 format 999
column h05 format 999
column h06 format 999
column h07 format 999
column h08 format 999
column h09 format 999
column h10 format 999
column h11 format 999
column h12 format 999
column h13 format 999
column h14 format 999
column h15 format 999
column h16 format 999
column h17 format 999
column h18 format 999
column h19 format 999
column h20 format 999
column h21 format 999
column h22 format 999
column h23 format 999
column h24 format 999
break on report
compute max of "total" on report
compute max of "h01" on report
compute max of "h02" on report
compute max of "h03" on report
compute max of "h04" on report
compute max of "h05" on report
compute max of "h06" on report
compute max of "h07" on report
compute max of "h08" on report
compute max of "h09" on report
compute max of "h10" on report
compute max of "h11" on report
compute max of "h12" on report
compute max of "h13" on report
compute max of "h14" on report
compute max of "h15" on report
compute max of "h16" on report
compute max of "h17" on report
compute max of "h18" on report
compute max of "h19" on report
compute max of "h20" on report
compute max of "h21" on report
compute max of "h22" on report
compute max of "h23" on report
compute sum of NUM on report
compute sum of GB on report
compute sum of MB on report
compute sum of KB on report

/* Report the Redo Log Switch History */

alter session set nls_date_format='DD MON YYYY';
select thread#, trunc(completion_time) as "date", to_char(completion_time,'Dy') as "Day", count(1) as "total",
sum(decode(to_char(completion_time,'HH24'),'00',1,0)) as "h00",
sum(decode(to_char(completion_time,'HH24'),'01',1,0)) as "h01",
sum(decode(to_char(completion_time,'HH24'),'02',1,0)) as "h02",
sum(decode(to_char(completion_time,'HH24'),'03',1,0)) as "h03",
sum(decode(to_char(completion_time,'HH24'),'04',1,0)) as "h04",
sum(decode(to_char(completion_time,'HH24'),'05',1,0)) as "h05",
sum(decode(to_char(completion_time,'HH24'),'06',1,0)) as "h06",
sum(decode(to_char(completion_time,'HH24'),'07',1,0)) as "h07",
sum(decode(to_char(completion_time,'HH24'),'08',1,0)) as "h08",
sum(decode(to_char(completion_time,'HH24'),'09',1,0)) as "h09",
sum(decode(to_char(completion_time,'HH24'),'10',1,0)) as "h10",
sum(decode(to_char(completion_time,'HH24'),'11',1,0)) as "h11",
sum(decode(to_char(completion_time,'HH24'),'12',1,0)) as "h12",
sum(decode(to_char(completion_time,'HH24'),'13',1,0)) as "h13",
sum(decode(to_char(completion_time,'HH24'),'14',1,0)) as "h14",
sum(decode(to_char(completion_time,'HH24'),'15',1,0)) as "h15",
sum(decode(to_char(completion_time,'HH24'),'16',1,0)) as "h16",
sum(decode(to_char(completion_time,'HH24'),'17',1,0)) as "h17",
sum(decode(to_char(completion_time,'HH24'),'18',1,0)) as "h18",
sum(decode(to_char(completion_time,'HH24'),'19',1,0)) as "h19",
sum(decode(to_char(completion_time,'HH24'),'20',1,0)) as "h20",
sum(decode(to_char(completion_time,'HH24'),'21',1,0)) as "h21",
sum(decode(to_char(completion_time,'HH24'),'22',1,0)) as "h22",
sum(decode(to_char(completion_time,'HH24'),'23',1,0)) as "h23"
from
v$archived_log
where first_time > trunc(sysdate-10)
and dest_id = (select dest_id from V$ARCHIVE_DEST_STATUS where status='VALID' and type='LOCAL')
group by thread#, trunc(completion_time), to_char(completion_time, 'Dy') order by 2,1;

/* calculate the archive log size generated per day for each Instances. */

select THREAD#, trunc(completion_time) as "DATE"
, count(1) num
, trunc(sum(blocks*block_size)/1024/1024/1024) as GB
, trunc(sum(blocks*block_size)/1024/1024) as MB
, sum(blocks*block_size)/1024 as KB
from v$archived_log
where first_time > trunc(sysdate-10)
and dest_id = (select dest_id from V$ARCHIVE_DEST_STATUS where status='VALID' and type='LOCAL')
group by thread#, trunc(completion_time)
order by 2,1
;
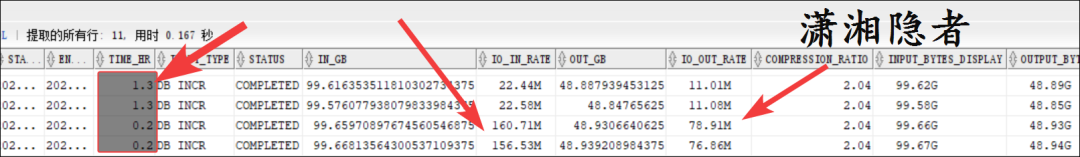
排除了上面两大类因素后,那么导致RMAN备份作业变慢的可能因素只能是硬件资源问题了,我们使用下面脚本查询RMAN备份记录信息,发现备份文件的大小并没有增长,其实也侧面验证数据库大小没有变化,归档日志没有暴增。其实排查的步骤应该先通过这个脚本查看备份文件大小是否有较大变化,如果OUT_GB没有太大变化,可以直接跳过备份数据量增长因素,直接排查其他原因,如果备份数据量(OUT_DB字段值)有较大波动,那么就可以按上面步骤进行排查;检查数据过程中,发现IO_IN_RATE和IO_OUT_RATE这个字段的数据在问题出现前后出现很大幅度的变化,这两个指标出现问题,不一定就意味着存储IO出现了性能问题,只能说存储设备出现IO性能的可能性非常大。也有可能由网络带宽导致。
SELECT CON_ID
     , TO_CHAR(START_TIME, 'YYYY-MM-DD HH24:MI:SS') START_TIME
     , TO_CHAR(END_TIME, 'YYYY-MM-DD HH24:MI:SS') END_TIME
     , ROUND (ELAPSED_SECONDS/3600, 1) TIME_HR
     , INPUT_TYPE
     , STATUS
     , INPUT_BYTES/1024/1024/1024   IN_GB
     , INPUT_BYTES_PER_SEC_DISPLAY  IO_IN_RATE
     , OUTPUT_BYTES/1024/1024/1024  OUT_GB
     , OUTPUT_BYTES_PER_SEC_DISPLAY IO_OUT_RATE
     , ROUND(COMPRESSION_RATIO,2)   COMPRESSION_RATIO
     , INPUT_BYTES_DISPLAY
     , OUTPUT_BYTES_DISPLAY
     , OUTPUT_DEVICE_TYPE
FROM V$RMAN_BACKUP_JOB_DETAILS
WHERE START_TIME > SYSDATE - 14
    AND INPUT_TYPE='DB INCR'
 ORDER BY START_TIME ASC;
因为DP是将备份备份到虚拟带库,同一网段和区域,不止这一台数据库服务器,对比发现只有这一台数据库的备份时间变长,备份变慢。经过和系统管理员的沟通排查后排除是存储IO性能问题。接下来最可疑的就是网络带宽问题了,我之前工作中也遇到过网络带宽引起备份作业变慢的案例:Symantec Backup Exec服务器的网卡从千兆速率变成了百兆速率,引起Symantec Backup Exec的所有作业变慢,备份时间大幅拉长的情况。登录Windows服务器检查服务器的网卡(双网卡),检查发现备份使用的网卡(backup)速率是百兆速率。如下截图所示:

检查网卡当前设置为‘自适应’(Auto Negotiation),系统管理员建议网络组同事检查交换机端口状态

网络组同事检查交换机日志,发现这台机器在出现问题前有down/up记录。而且交换机接口是常规配置,自适应速率, 网口支持10/100/1000BaseTX
Jan 12 2023 14:05:34.361 Beijing: %LINEPROTO-5-UPDOWN: Line protocol on Interface GigabitEthernet1/0/27, changed state to down
Jan 12 2023 14:05:35.363 Beijing: %LINK-3-UPDOWN: Interface GigabitEthernet1/0/27, changed state to down
Jan 12 2023 14:05:57.877 Beijing: %LINK-3-UPDOWN: Interface GigabitEthernet1/0/27, changed state to up
Jan 12 2023 14:05:58.877 Beijing: %LINEPROTO-5-UPDOWN: Line protocol on Interface GigabitEthernet1/0/27, changed state to up
按网络组同事的意思,怀疑可能是网线接头松动了。他们去机房重新拔插了一下网线后,第二天的备份就正常了,如下截图所示,备份时间从1.3h(1小时18分)变成了0.2h,IO_IN_RATE也从22M左右变成了160M左右,IO_OUT_RATE从11M左右变成了70M左右