


PG菜鸟入门学习中,欢迎各位大佬留言技术指导。
BG
PG 学习群中提及了复杂且很难理解的 PostgreSQL 内存结构,但是有两个常用的必备工具是要学会如何使用的。
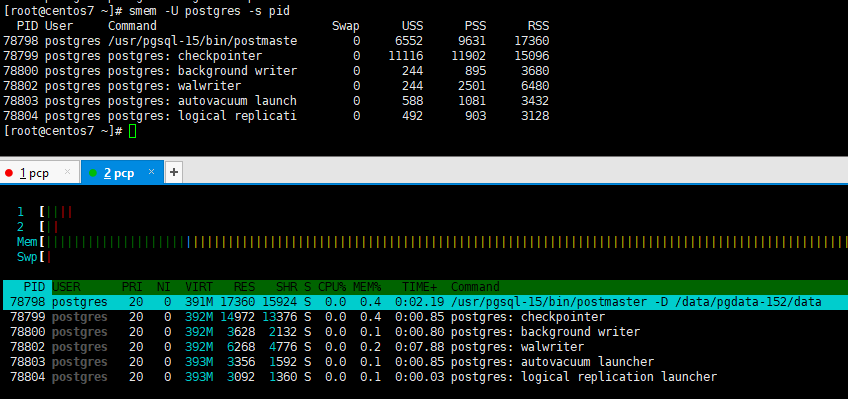
如图所示,上半部分是 smem 工具,下半部分是 htop 工具。
这两个是系统工具,OS层面使用,除此之外,还有 2 个 PG15 引入的参数,以及几个 PG 插件,以 postgresql 的 extension 形式安装,当然还有 PostgreSQL ,下面会逐一说明。
smem
SMEM 是一个内存报告工具,可以根据GNU通用公共许可证第2版或更高版本的条款使用和分发。
可以通过 yum 直接安装,但其逻辑本身是通过 Python 语言实现。
扫描系统的 /proc/ 路径,抓取并处理相关信息。输入选项 --help 即可打印出所有选项。
$ smem --help
Usage: smem [options]

Options:
  -h, --help            show this help message and exit
  -H, --no-header       disable header line
  -c COLUMNS, --columns=COLUMNS
                        columns to show
  -t, --totals          show totals
  -R REALMEM, --realmem=REALMEM
                        amount of physical RAM
  -K KERNEL, --kernel=KERNEL
                        path to kernel image
  -m, --mappings        show mappings
  -u, --users           show users
  -w, --system          show whole system
  -P PROCESSFILTER, --processfilter=PROCESSFILTER
                        process filter regex
  -M MAPFILTER, --mapfilter=MAPFILTER
                        map filter regex
  -U USERFILTER, --userfilter=USERFILTER
                        user filter regex
  -n, --numeric         numeric output
  -s SORT, --sort=SORT  field to sort on
  -r, --reverse         reverse sort
  -p, --percent         show percentage
  -k, --abbreviate      show unit suffixes
  --pie=PIE             show pie graph
  --bar=BAR             show bar graph
  -S SOURCE, --source=SOURCE
                        /proc data source
列举几个日常用法:
- 查看 postgres 用户的相关进程及内存使用情况
$ smem -U postgres
  PID User     Command                         Swap      USS      PSS      RSS
2294087 postgres postgres: archiver                 0      128      281     1952
2294081 postgres postgres: logger                   0      204      348     1988
2294088 postgres postgres: stats collector          0      268      424     2152
2294089 postgres postgres: logical replicati        0      496      852     2912
2294086 postgres postgres: autovacuum launch        0      652     1091     3304
3037181 postgres -bash                              0     1348     1575     3064
2294084 postgres postgres: background writer        0      224     6052    19192
3037422 postgres python /bin/smem -U postgre        0     6028     6302     7404
2294083 postgres postgres: checkpointer             0      616     6616    20128
2294085 postgres postgres: walwriter                0      208     8581    18612
2294080 postgres /opt/postgresql/bin/postgre        0    51252    65979    89356
- 格式化输出数字,转为更为优雅的展示格式, 并计算打印总和。
$ smem -U postgres -k 'M' -t
  PID User     Command                         Swap      USS      PSS      RSS
2294087 postgres postgres: archiver                 0   128.0K   281.0K     1.9M
2294081 postgres postgres: logger                   0   204.0K   348.0K     1.9M
2294088 postgres postgres: stats collector          0   268.0K   424.0K     2.1M
2294089 postgres postgres: logical replicati        0   496.0K   852.0K     2.8M
2294086 postgres postgres: autovacuum launch        0   652.0K     1.1M     3.2M
3037181 postgres -bash                              0     1.3M     1.5M     3.0M
2294084 postgres postgres: background writer        0   224.0K     5.9M    18.7M
3037559 postgres python /bin/smem -U postgre        0     5.9M     6.2M     7.2M
2294083 postgres postgres: checkpointer             0   616.0K     6.5M    19.7M
2294085 postgres postgres: walwriter                0   208.0K     8.4M    18.2M
2294080 postgres /opt/postgresql/bin/postgre        0    50.1M    64.4M    87.3M
-------------------------------------------------------------------------------
   11 1                                           0    60.0M    95.8M   166.1M
- 按 PSS 进行逆序排序。
$ smem -U postgres -k 'M' -t -s pss -r
  PID User     Command                         Swap      USS      PSS      RSS
2294080 postgres /opt/postgresql/bin/postgre        0    50.1M    64.4M    87.3M
2294085 postgres postgres: walwriter                0   208.0K     8.4M    18.2M
2294083 postgres postgres: checkpointer             0   616.0K     6.5M    19.7M
3037672 postgres python /bin/smem -U postgre        0     5.9M     6.2M     7.2M
2294084 postgres postgres: background writer        0   224.0K     5.9M    18.7M
3037181 postgres -bash                              0     1.3M     1.5M     3.0M
2294086 postgres postgres: autovacuum launch        0   652.0K     1.1M     3.2M
2294089 postgres postgres: logical replicati        0   496.0K   852.0K     2.8M
2294088 postgres postgres: stats collector          0   268.0K   424.0K     2.1M
2294081 postgres postgres: logger                   0   204.0K   348.0K     1.9M
2294087 postgres postgres: archiver                 0   128.0K   281.0K     1.9M
-------------------------------------------------------------------------------
   11 1                                           0    60.0M    95.8M   166.1M
- 如需展示 VSS 需要指定列
$ smem -U postgres -k 'M' -s vss -r -c 'command uss pss rss vss'
Command                          USS      PSS      RSS      VSS
postgres: autovacuum launch   652.0K     1.1M     3.2M     2.3G
postgres: logical replicati   496.0K   852.0K     2.8M     2.3G
postgres: checkpointer        616.0K     6.5M    19.7M     2.3G
postgres: background writer   224.0K     5.9M    18.7M     2.3G
postgres: walwriter           208.0K     8.4M    18.2M     2.3G
/opt/postgresql/bin/postgre    50.1M    64.4M    87.3M     2.3G
postgres: stats collector     268.0K   424.0K     2.1M   229.8M
postgres: archiver            128.0K   281.0K     1.9M   229.7M
postgres: logger              200.0K   344.0K     1.9M   227.6M
-bash                           1.5M     1.7M     3.1M   113.9M
python /bin/smem -U postgre     5.9M     6.2M     7.2M    44.1M
上述示例中,出现几个专业词汇缩写,其含义如下:
- Swap: 所消耗的交换空间量(忽略共享)
- USS: Unique Set Size 进程独自占用的物理内存
- PSS: Proportional Set Size 实际使用的物理内存 (包含共享)
- RSS: Resident Set Size 实际使用物理内存(忽略共享)
- VSS: Virtual Set Size 虚拟耗用内存(映射的虚拟内存总数)
最后,smem 还可以输出饼图,图形化的方式,展示各进程的内存占比。
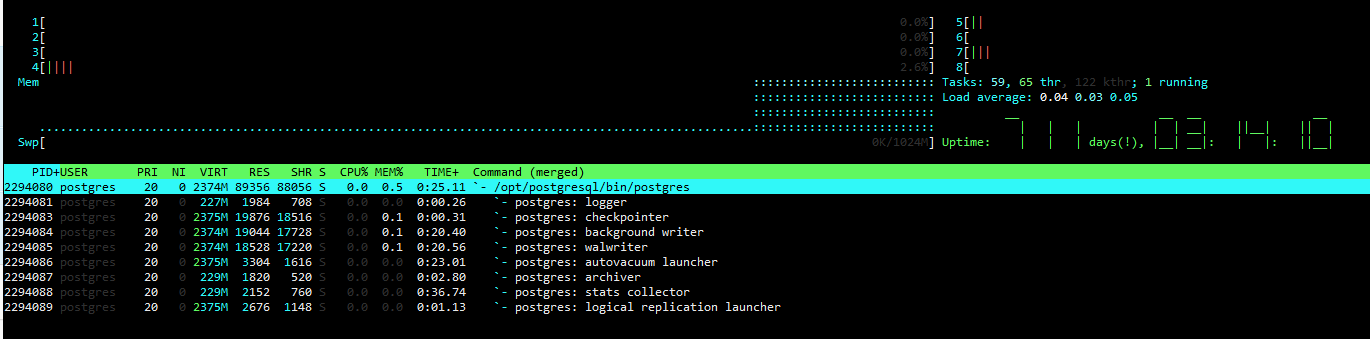
htop
htop 是一个免费的(GPL)基于 ncurses(提供字符终端处理库) 的Linux进程查看器。
它与 top 类似,但允许您垂直和水平滚动,以便您可以看到系统上运行的所有进程及其完整的命令行,以及将它们视为进程树。
目前,htop 最新版本为 v3.2.2, 感兴趣的同学可以自行下载编译使用。
$ ./htop --help
htop 3.2.2
(C) 2004-2019 Hisham Muhammad. (C) 2020-2023 htop dev team.
Released under the GNU GPLv2+.
...
额外需要注意的是,htop带有 kill 功能,此功能请慎用。
shared_memory_size & shared_memory_size_in_huge_pages
在 PostgreSQL 15.0 的发版说明中有介绍到新增了两个参数。
shared_memory_size
添加服务器变量 shared_memory_size 来报告已分配共享内存的大小(Nathan Bossart)
报告主共享内存区域的大小,四舍五入到最近的兆字节。
postgres=# show shared_memory_size;
 shared_memory_size
--------------------
 145MB
(1 row)
shared_memory_size_in_huge_pages
添加服务器变量 shared_memory_size_in_huge_pages 以报告所需的巨大内存页的数量(Nathan Bossart)
根据指定的 huge_page_size 报告主共享内存区域所需的大页数。 如果不支持大页面,则该值为-1。
该设置仅在Linux操作系统下支持。 在其他平台上它总是被设置为-1。
postgres=# show shared_memory_size_in_huge_pages;
 shared_memory_size_in_huge_pages
----------------------------------
 73
(1 row)
另外一个知识点,PG15 扩展了元命令 \dconfig 可以一次性查看若干参数设定。
(postgres@[local]) [postgres] 12:34:51# \dconfig+ *share*
                           List of configuration parameters
+----------------------------------+-------+---------+------------+-------------------+
|            Parameter             | Value |  Type   |  Context   | Access privileges |
+----------------------------------+-------+---------+------------+-------------------+
| dynamic_shared_memory_type       | posix | enum    | postmaster |                   |
| min_dynamic_shared_memory        | 0     | integer | postmaster |                   |
| shared_buffers                   | 128MB | integer | postmaster |                   |
| shared_memory_size               | 143MB | integer | internal   |                   |
| shared_memory_size_in_huge_pages | 72    | integer | internal   |                   |
| shared_memory_type               | mmap  | enum    | postmaster |                   |
| shared_preload_libraries         |       | string  | postmaster |                   |
+----------------------------------+-------+---------+------------+-------------------+
(7 rows)
可以看到当前 PG 的设定,dynamic_shared_memory_type 为 posix ,该参数指定服务器应使用的动态共享内存实现。 可能的值有posix(使用shm_open分配posix共享内存)、sysv(通过shmget分配System V共享内存)、windows(使用windows共享内存)和mmap(使用存储在data目录中的内存映射文件模拟共享内存)。
pg_stat_monitor
pg_stat_monitor 是由 Percona 公司开发的 PostgreSQL 的查询性能监控工具。 它在单个视图中收集性能统计信息并提供查询性能洞察。 这些见解允许数据库用户了解查询起源、执行、计划统计信息和详细信息、查询信息和元数据。 这极大地提高了可观察性,使用户能够调试和调优查询性能。
该插件,编译安装好之后,需要加入到预加载配置项,并重新启动 postgres。
shared_preload_libraries='pg_stat_monitor'
安装后,可通过表格查询某条查询语句造成的共享块变动信息。
select
 userid, datname, queryid,
 shared_blks_hit, shared_blks_read, shared_blks_dirtied, shared_blks_written
 from pg_stat_monitor
 order by shared_blks_hit desc;

+--------+----------+----------------------+-----------------+------------------+---------------------+---------------------+
| userid | datname  |       queryid        | shared_blks_hit | shared_blks_read | shared_blks_dirtied | shared_blks_written |
+--------+----------+----------------------+-----------------+------------------+---------------------+---------------------+
|     10 | postgres | -7568047705441758065 |             186 |                0 |                   0 |                   0 |
|     10 | postgres | -7568047705441758065 |             183 |                0 |                   0 |                   0 |
|     10 | postgres |  3798936806175822236 |               7 |                0 |                   0 |                   0 |
|     10 | postgres | -3691512427099624923 |               4 |                0 |                   0 |                   0 |
|     10 | postgres | -3691512427099624923 |               4 |                0 |                   0 |                   0 |
|     10 | postgres |  3798936806175822236 |               4 |                0 |                   0 |                   0 |
|     10 | postgres | -4203261276791970850 |               3 |                0 |                   0 |                   0 |
|     10 | postgres |  -821424691740446851 |               0 |                0 |                   0 |                   0 |
|     10 | postgres | -4203261276791970850 |               0 |                0 |                   0 |                   0 |
|     10 | postgres |  7280225642777516882 |               0 |                0 |                   0 |                   0 |
|     10 | postgres | -9125306597209436601 |               0 |                0 |                   0 |                   0 |
|     10 | postgres |  2301278004764654168 |               0 |                0 |                   0 |                   0 |
|     10 | postgres |   229654144954915736 |               0 |                0 |                   0 |                   0 |
|     10 | postgres | -9125306597209436601 |               0 |                0 |                   0 |                   0 |
|     10 | postgres |  4513628886796981822 |               0 |                0 |                   0 |                   0 |
+--------+----------+----------------------+-----------------+------------------+---------------------+---------------------+
(15 rows)
这里提示四个关键列值需要注意:
- shared_blks_hit 显示从缓存返回的共享内存块的总数
- shared_blks_read 显示非缓存返回的共享块的总数
- shared_blks_dirtied 显示被查询执行“脏”块的共享内存块的数量(例如,查询修改了一个块中的至少一个元组,并且该块必须写入驱动器)
- shared_blks_written 显示在查询执行期间同时写入驱动器的共享内存块的数量
其他信息可参考:PostgreSQL性能监控工具之pg_stat_monitor插件
system_stats
system_stats 是一个 PostgreSQL 扩展插件, 由 EDB 公司开发维护,它提供了访问系统级统计信息的函数,可以用于监控。
支持Linux、macOS和Windows操作系统。注意,并非所有值都与所有操作系统相关。在这种情况下,受影响的值将返回NULL。
该插件提供了两个函数可供观测内存。
示例如下,可与 free 对比查看。
- pg_sys_memory_info
该接口允许用户获取内存使用信息。 所有的值都以字节为单位。
(postgres@[local]) [postgres] 22:38:01# select pg_sys_memory_info();
+-[ RECORD 1 ]-------+--------------------------------------------------------------------------------+
| pg_sys_memory_info | (3953745920,3791622144,162123776,2147479552,532480,2146947072,2944073728,,,,,) |
+--------------------+--------------------------------------------------------------------------------+

(postgres@[local]) [postgres] 22:37:45# \! free -kb
              total        used        free      shared  buff/cache   available
Mem:     3953745920   620945408   161964032   308969472  3170836480  2727837696
Swap:    2147479552      532480  2146947072
- pg_sys_cpu_memory_by_process
该接口允许用户获取每个进程 ID 的 CPU 和内存信息。
示例如下,该方法列举的进程过多,这里只截取了 postgres 进程信息。
(postgres@[local]) [postgres] 22:41:54# select pg_sys_cpu_memory_by_process();
+--------------------------------------------------+
|           pg_sys_cpu_memory_by_process           |
+--------------------------------------------------+
| (1,"(systemd)",160219,0,0.12,4579328)            |
...
| (120123,"(postgres)",1930,0,7.22,285437952)      |
| (120124,"(postgres)",1930,0,0.09,3727360)        |
| (120125,"(postgres)",1930,0,0.07,2650112)        |
| (120127,"(postgres)",1930,0,0.14,5365760)        |
| (120128,"(postgres)",1930,0,0.06,2355200)        |
| (120129,"(postgres)",1930,0,0.05,2101248)        |
pg_stat_kcache
该插件是由 PoWA 团队开发的,主要编写语言为 C 语言。
PoWA 是一个开源项目,是一个PostgreSQL工作负载分析器,它收集性能统计数据,并提供实时图表和图形来帮助监视和优化PostgreSQL服务器。
该插件可用于收集文件系统层实际读写的统计信息,依赖,并需要先安装 pg_stat_statements 扩展。
该模块需要一些共享内存来保存它的计数器,这个模块必须在PostgreSQL启动时加载。
shared_preload_libraries = 'pg_stat_statements,pg_stat_kcache'
可通过下面方法调用该函数:
SELECT * FROM pg_stat_kcache();
Debug Info
编译 PostgreSQL 源码时,可以加入两个 debug 参数,--enable-debug --enable-dtrace,以开启部分 debug 信息。
psql 进入到服务器后,可以看到有如下几个 debug 参数,
(postgres@[local]) [postgres] 19:12:30# \dconfig+ *debug*
                         List of configuration parameters
+-----------------------+-------+---------+-------------------+-------------------+
|       Parameter       | Value |  Type   |      Context      | Access privileges | mark by Yan.
+-----------------------+-------+---------+-------------------+-------------------+
| debug_assertions      | off   | bool    | internal          |                   | --enable-cassert
| debug_discard_caches  | 0     | integer | superuser         |                   | +V14, prod: 0
| debug_pretty_print    | on    | bool    | user              |                   |
| debug_print_parse     | off   | bool    | user              |                   |
| debug_print_plan      | off   | bool    | user              |                   |
| debug_print_rewritten | off   | bool    | user              |                   |
| jit_debugging_support | off   | bool    | superuser-backend |                   | +V11, LLVM
+-----------------------+-------+---------+-------------------+-------------------+
(7 rows)
PG v14 引入了新参数 debug_discard_caches, PG v15 没有变化。
MemoryContextStats
下面说说 gdb 调试,
在之前版本的文档中,可以看到如下两个命令,来打印内存上下文情况。
gdb --batch-silent -ex 'call MemoryContextStats(TopMemoryContext,100)' -p 107398
gdb --batch-silent -ex 'call MemoryContextStatsDetail(TopMemoryContext,100)' -p 105941
但从 PostgreSQL v14 开始,MemoryContextStatsDetail 增加了第三个参数,是否打印到 stderr。
/*
 * You should not do memory allocations within a critical section, because
@@ -499,28 +505,52 @@ void
MemoryContextStats(MemoryContext context)
{
	/* A hard-wired limit on the number of children is usually good enough */
	MemoryContextStatsDetail(context, 100, true);
}

/*
 * MemoryContextStatsDetail
 *
 * Entry point for use if you want to vary the number of child contexts shown.
 *
 * If print_to_stderr is true, print statistics about the memory contexts
 * with fprintf(stderr), otherwise use ereport().
 */
void
MemoryContextStatsDetail(MemoryContext context, int max_children,
						 bool print_to_stderr)
所以,如果继续用上面的命令,就会遇到如下报错。
[root@centos7 ~]# gdb --batch-silent -ex 'call MemoryContextStatsDetail(TopMemoryContext, 100)' -p 118791
Too few arguments in function call.
来看下 print_to_stderr 两个值的差别:
- true
[root@centos7 ~]# gdb --batch-silent -ex 'call MemoryContextStatsDetail(TopMemoryContext, 100, 1)' -p 118791

[postgres@centos7 log]$ TopMemoryContext: 8192 total in 1 blocks; 6920 free (0 chunks); 1272 used
  LOCALLOCK hash: 8192 total in 1 blocks; 552 free (0 chunks); 7640 used
  Timezones: 104120 total in 2 blocks; 2616 free (0 chunks); 101504 used
  Postmaster: 8192 total in 1 blocks; 7368 free (7 chunks); 824 used
    ident parser context: 1024 total in 1 blocks; 760 free (0 chunks); 264 used
    hba parser context: 17408 total in 5 blocks; 8120 free (6 chunks); 9288 used
  ErrorContext: 8192 total in 1 blocks; 7928 free (5 chunks); 264 used
Grand total: 155320 bytes in 12 blocks; 34264 free (18 chunks); 121056 used
- false
[root@centos7 ~]# gdb --batch-silent -ex 'call MemoryContextStatsDetail(TopMemoryContext, 100, 0)' -p 118791

[postgres@centos7 log]$ 2023-03-05 21:23:46.362 CST [118791] LOG:  level: 0; TopMemoryContext: 8192 total in 1 blocks; 6920 free (0 chunks); 1272 used
2023-03-05 21:23:46.362 CST [118791] LOG:  level: 1; LOCALLOCK hash: 8192 total in 1 blocks; 552 free (0 chunks); 7640 used
2023-03-05 21:23:46.362 CST [118791] LOG:  level: 1; Timezones: 104120 total in 2 blocks; 2616 free (0 chunks); 101504 used
2023-03-05 21:23:46.362 CST [118791] LOG:  level: 1; Postmaster: 8192 total in 1 blocks; 7368 free (7 chunks); 824 used
2023-03-05 21:23:46.362 CST [118791] LOG:  level: 2; ident parser context: 1024 total in 1 blocks; 760 free (0 chunks); 264 used
2023-03-05 21:23:46.362 CST [118791] LOG:  level: 2; hba parser context: 17408 total in 5 blocks; 8120 free (6 chunks); 9288 used
2023-03-05 21:23:46.362 CST [118791] LOG:  level: 1; ErrorContext: 8192 total in 1 blocks; 7928 free (5 chunks); 264 used
2023-03-05 21:23:46.362 CST [118791] LOG:  Grand total: 155320 bytes in 12 blocks; 34264 free (18 chunks); 121056 used

[postgres@centos7 log]$
需要补充道,PostgreSQL 14 还增加了方法:pg_log_backend_memory_contexts(),来指示服务器用指定的PID记录后台的内存上下文。
SELECT pg_log_backend_memory_contexts(2294080);
End
PostgreSQL 作为学院派数据库的典型代表,其功能特性还是值得深挖研究的,追根溯源,很多国产数据库里都有 PostgreSQL 的影子,学好 PostgreSQL 也为“换梯子”到国产数据库做了技术积累与铺垫。
PostgreSQL 的扩展模块开放了一个很规范的接口模型,可以便利的使用其他厂商开源的插件,也为开发者自定义开发插件提供了便利。
作为查看内存信息的入门篇,本文只是从三个角度记录了大概模样,具体技术细节还有待进一步深挖研习。
