


点击上方“IT那活儿”公众号,关注后了解更多内容,不管IT什么活儿,干就完了!!!
Elasticsearch(存储分析) Logstash(采集过滤) Kibana(展示)
1. 特点
Elasticsearch :支持集群、数据分片和备份;RESTful 接口;支持JSON; Logstash :通过插件实现日志多输入的收集转发,支持日志过滤;支持自定义 JSON 格式的日志解析; Kibana :通过 Elasticsearch 的API接口进行数据操作 ,可以生成表格、绘制各种图形; Filebeat:是用于转发和集中日志数据的轻量级传送工具。Filebeat监视指定的日志文件或位置,收集日志事件,并将它们转发到Elasticsearch或 Logstash进行索引。
2. 作用
分布式日志数据统一收集,实现集中查询和管理分布式日志; 安全信息和事件管理; 报表功能; 故障恢复,故障自愈; 性能分析,用户行为分析。
3. 架构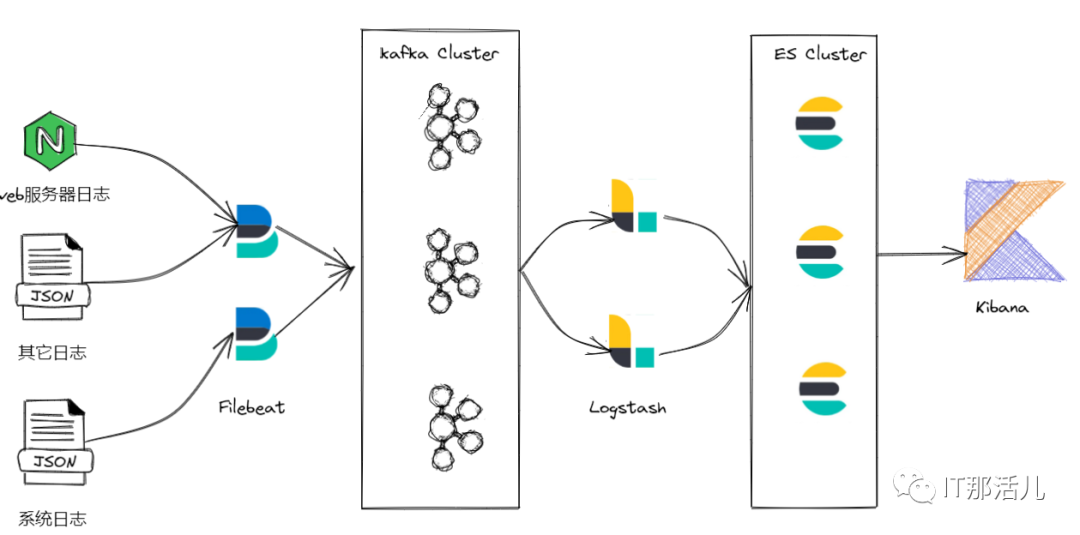
2. 硬件要求
所有节点在同一内网环境,保证传输效率及安全。
3. 关闭SELinux
setenforce 0
vi /etc/selinux/config
SELINUX=disabled
4. 关闭防火墙
Centos 7/Redhat 7:
--禁止防火墙开机启动:systemctl disable firewalld.service
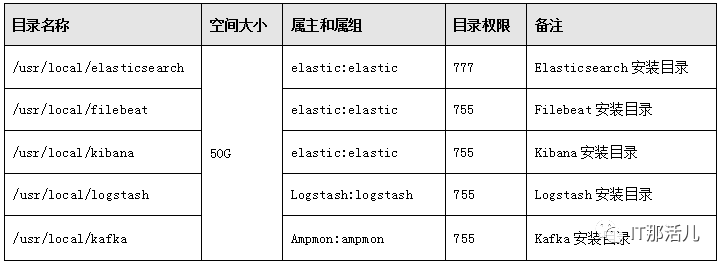
5. 用户及用户组要求
6. 系统目录要求
1. 版本要求
2. 安装elasticsearch
注:
以下命令 # 开头为root用户执行, $ 开头为elastic用户执行; 以下步骤 基于CentOS 7.9安装 ,请根据实际系统环境自行调整 。
# groupadd -r elasticsearch
# useradd -r -g elasticsearch -s sbin/nologin -c
"elasticsearch user" -M elasticsearch
#cd /app/software/
#tar -zxvf elasticsearch-8.4.2-linux-x86_64.tar.gz -C usr/local/
#ln -sv /usr/local/elasticsearch-8.4.2 /app/elasticsearch
#cd /app/elasticsearch
#mkdir data
#chown -R elastic:elastic /usr/local/elasticsearch-8.4.2
#chown -R elastic:elastic /app/elasticsearch
# vim /etc/hosts
192.168.80.30 node-1
192.168.80.32 node-2
192.168.80.33 node-3
192.168.80.34 node-4
192.168.80.35 node-5
#echo "vm.max_map_count = 655350" >> /etc/sysctl.conf
#vim /etc/security/limits.conf
cachecloud-open soft nofile 65535
cachecloud-open hard nofile 65535
$vim /app/elasticsearch/config/elasticsearch.yml
cluster.name: my-application
node.name: node-3
path.data: /app/elasticsearch/data/
path.logs: /app/elasticsearch/logs/
network.host: 192.168.80.32
http.port: 9200
discovery.seed_hosts:
["192.168.80.32", "192.168.80.33","192.168.80.34"]
cluster.initial_master_nodes:
 ["192.168.80.32", "192.168.80.33","192.168.80.34"]
readiness.port: 9399
xpack.security.enabled: false
ingest.geoip.downloader.enabled: false
$cd /app/elasticsearch/bin/
$nohup ./elasticsearch >/dev/null &
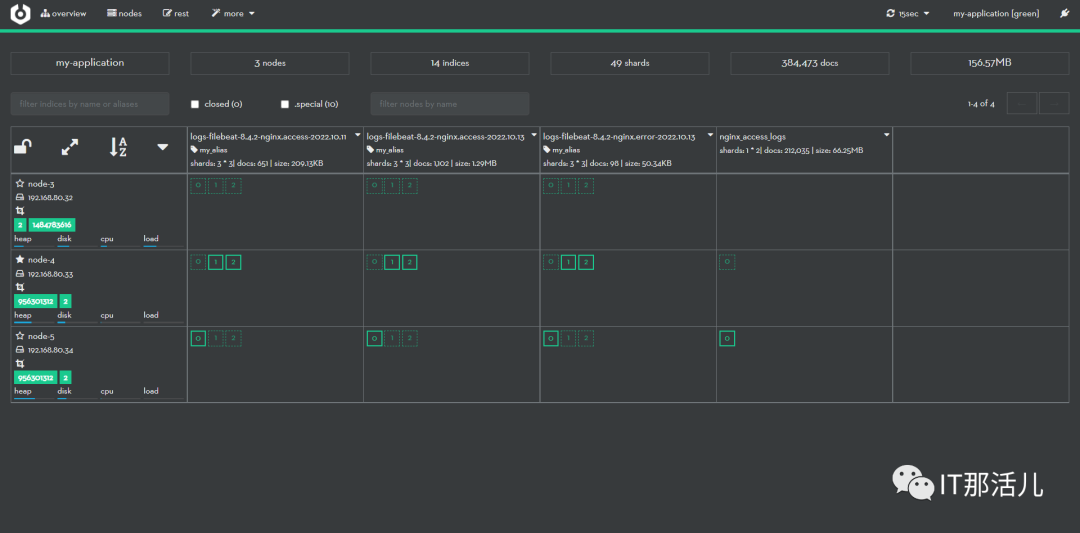
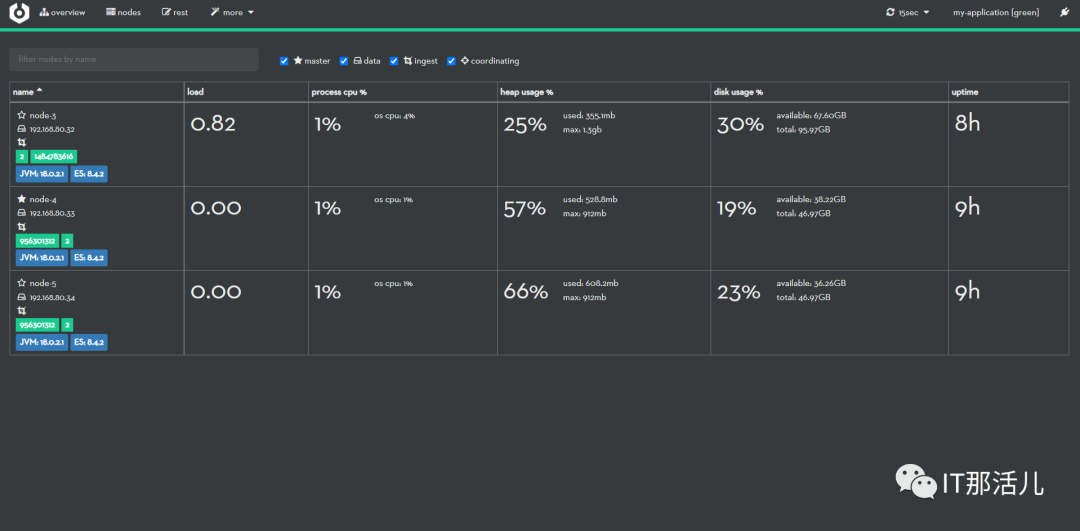
3. 安装cerebro
#tar -zxvf cerebro-0.9.4.tgz -C /usr/local/
#ln -sv /usr/local/cerebro-0.9.4/ /app/cerebro
$chown -R elastic:elastic /usr/local/cerebro-0.9.4/
$chown -R elastic:elastic /app/cerebro/
$cd /app/cerebro/conf/
$vim application.conf
     secret = "ki:s:[[@=Ag?QI`W2jMwkY:eqvrJ]JqoJyi2axj3ZvOv^/KavOT4ViJSv?6YY4[N"
    basePath = "/"
    pidfile.path=/dev/null
    rest.history.size = 50 // defaults to 50 if not specified
    data.path = "./cerebro.db"
    play {
      server.http.port = ${?CEREBRO_PORT}
    }
    es = {
      gzip = true
    }
    auth = {
      # either basic or ldap
      type: ${?AUTH_TYPE}
      settings {
        # LDAP
        url = ${?LDAP_URL}
        # OpenLDAP might be something like "ou=People,dc=domain,dc=com"
        base-dn = ${?LDAP_BASE_DN}
        # Usually method should be "simple" otherwise, set it to the SASL mechanisms to try
        method = ${?LDAP_METHOD}
        # user-template executes a string.format() operation where
        # username is passed in first, followed by base-dn. Some examples
        # - %s => leave user untouched
        # - %s@domain.com => append "@domain.com" to username
        # - uid=%s,%s => usual case of OpenLDAP
        user-template = ${?LDAP_USER_TEMPLATE}
        // User identifier that can perform searches
        bind-dn = ${?LDAP_BIND_DN}
        bind-pw = ${?LDAP_BIND_PWD}
        group-search {
          // If left unset parent's base-dn will be used
          base-dn = ${?LDAP_GROUP_BASE_DN}
          // Attribute that represent the user, for example uid or mail
          user-attr = ${?LDAP_USER_ATTR}
          // Define a separate template for user-attr
          // If left unset parent's user-template will be used
          user-attr-template = ${?LDAP_USER_ATTR_TEMPLATE}
          // Filter that tests membership of the group. If this property is empty then there is no group membership check
          // AD example => memberOf=CN=mygroup,ou=ouofthegroup,DC=domain,DC=com
          // OpenLDAP example => CN=mygroup
          group = ${?LDAP_GROUP}
        }

        #Basic auth
        username = ${?BASIC_AUTH_USER}
        password = ${?BASIC_AUTH_PWD}
      }
    }

    hosts = [
      {
        host = "http://192.168.80.32:9200"
        name = "my-application"
      # headers-whitelist = [ "x-proxy-user", "x-proxy-roles", "X-Forwarded-For" ]
      },
]
$nohup ./cerebro -Dhttp.port=8099 &
4. 安装kibana
#cd /app/software/
# tar -zxvf kibana-8.4.2-linux-x86_64.tar.gz -C /usr/local/
# mv kibana-8.4.2-linux-x86_64.tar.gz log/
# tar -zxvf kibana-8.4.2-linux-x86_64.tar.gz -C /usr/local/
# ln -sv /usr/local/kibana-8.4.2/ /app/kibana
# cd /app/kibana/
$ vim kibana.yml
server.port: 5601
server.host: "192.168.80.34"
server.name: "192.168.80.34"
elasticsearch.hosts: ["http://192.168.80.32:9200",
"http://192.168.80.33:9200",
"http://192.168.80.34:9200"]
elasticsearch.pingTimeout: 1500
elasticsearch.requestTimeout: 30000
elasticsearch.maxSockets: 1024
path.data: /app/kibana/data/
pid.file: /app/kibana/kibana.pid
i18n.locale: "zh-CN"
$ nohup ./kibana &
访问kibana:
5. 安装Filebeat
创建目录并赋权:
#tar -zxvf /app/software/filebeat-8.4.2-linux-x86_64.tar.gz -C /usr/local/
#ln -sv /usr/local/filebeat-8.4.2-linux-x86_64/ /app/filebeat
$chown -R nginx:nginx /usr/local/filebeat-8.4.2-linux-x86_64
$chown -R nginx:nginx /app/filebeat
$cd /app/filebeat/modules.d
$vim nginx.yml.disabled
# Module: nginx
# Docs: https://www.elastic.co/guide/en/beats/filebeat/8.4/filebeat-module-nginx.html

- module: nginx
  # Access logs
  access:
    enabled: true
    var.path: ["/app/nginx/logs/access.log*"]
  # Error logs
  error:
    enabled: true
var.path: ["/app/nginx/logs/error.log*"]

  ingress_controller:
    enabled: false
$mv nginx.yml.disabled nginx.yml
$filebeat modules enable nginx
$cd /app/filebeat/
$vim filebeat.yml
filebeat.inputs:
- type: filestream
  id: node-1
  enabled: true
  paths:
    - /app/nginx/logs/access.log
  tags:
    - "json"
    - "nginx"
    - "access"
- type: filestream
  enabled: true
  paths:
    - /app/nginx/logs/error.log
  tags:
    - "nginx"
    - "error"
filebeat.config.modules:
  path: ${path.config}/modules.d/*.yml
  reload.enabled: false
setup.template.settings:
  index.number_of_shards: 1
setup.dashboard.enabled: true
setup.kibana:
  host: "http://192.168.80.34:5601"
output.kafka:
  hosts: ["192.168.80.30:9092","192.168.80.31:9092","192.168.80.32:9092"]
  topic: logs_nginx_access
  required_acks: 1
  compression: gzip
  max_message_bytes: 1000000
  worker: 2
  keep-alive: 10
processors:
  - add_host_metadata:
      when.not.contains.tags: forwarded
  - add_cloud_metadata: ~
  - add_docker_metadata: ~
  - add_kubernetes_metadata: ~
  - decode_json_fields:
      when.contains.tags: "json"
      fields: ["message"]
      target: "msg"
      overwrite_keys: false
      add_error_key: true
      max_depth: 3
  - drop_fields:
      fields: ["message"]
      when.contains.tags: "json"
  - drop_fields:
      fields: ["ecs", "log", "input", "agent"]
      ignore_missing: false
$cd filebeat/
$nohup ./filebeat -c filebeat.yml &
6. 安装kafka集群
# tar -zxvf /app/software/apache-zookeeper-3.7.1-bin.tar.gz -C /usr/local/
# ln -sv /usr/local/apache-zookeeper-3.7.1-bin/ /app/zookeeper
# mkdir /app/zookeeper/zkDatafile
# echo  /app/zookeeper/zkDatafile/myid > 1
# chown -R ampmon:ampmon /usr/local/apache-zookeeper-3.7.1-bin/
# chown -R ampmon:ampmon /app/zookeeper
$ vim /app/zookeeper/conf/zoo.cfg
tickTime=2000
initLimit=10
syncLimit=5
dataDir=/app/zookeeper/zkDatafile
clientPort=2181
server.1=192.168.80.30:2888:3888
server.2=192.168.80.31:2888:3888
server.3=192.168.80.32:2888:3888
$ cd /app/zookeeper/bin
$ ./zkServer.sh start
# tar -zxvf /app/software/kafka_2.13-3.1.0.tgz -C /usr/local/
#ln -sv /usr/local/kafka_2.13-3.1.0/ /app/kafka
#chown -R ampmon:ampmon /usr/local/kafka_2.13-3.1.0
#chown -R ampmon:ampmon /app/kafka
$vim /app/kafka/conf/server.properties
broker.id=1
listeners=PLAINTEXT://192.168.80.31:9092
num.network.threads=3
num.io.threads=8
socket.send.buffer.bytes=102400
socket.receive.buffer.bytes=102400
socket.request.max.bytes=104857600
log.dirs=/tmp/kafka-logs
num.partitions=1
num.recovery.threads.per.data.dir=1
offsets.topic.replication.factor=1
transaction.state.log.replication.factor=1
transaction.state.log.min.isr=1
log.retention.hours=168
log.segment.bytes=1073741824
log.retention.check.interval.ms=300000
zookeeper.connect=192.168.80.30:2181,192.168.80.31:2181,192.168.80.32:2181
zookeeper.connection.timeout.ms=18000
group.initial.rebalance.delay.ms=0
$cd /app/kafka/bin/
$ ./kafka-server-start.sh -daemon /app/kafka/config/server.properties
#groupadd logstash
#useradd -g logstash logstash
#tar -zxvf logstash-8.4.2-linux-x86_64.tar.gz -C /usr/local/
#ln -sv /usr/local/logstash-8.4.2/ /app/logstash
#chown -R logstash:logstash /usr/local/logstash-8.4.2/
#chown -R logstash:logstash /app/logstash
$ mkdir -p /app/logstash/config/conf.d
$ cat > /etc/default/logstash << EOF
LS_HOME="/app/logstash"
LS_SETTINGS_DIR="/etc/logstash"
LS_PIDFILE="/var/run/logstash.pid"
LS_USER="logstash"
LS_GROUP="logstash"
LS_GC_LOG_FILE="/var/log/logstash/gc.log"
SERVICE_NAME="logstash"
SERVICE_DESCRIPTION="logstash"
$vim /etc/logstash/conf.d/collect.conf
input {
kafka {
bootstrap_servers => ["192.168.80.30:9092,192.168.80.31:9092,192.168.80.32:9092"]
topics_pattern => logs_nginx_access
consumer_threads => 1
auto_offset_reset => "earliest"
group_id => "logstash-group"
decorate_events => "basic"
}
}
filter {
json {
source => "message"
target => ""
}
mutate {
remove_field => ["message"]
}
if "nginx" in [tags] and "access" in [tags]{
mutate {
add_field => {
"[@metadata][target_index]" => "logs-%{[@metadata][beat]}-%{[@metadata][version]}-nginx.access-%{+YYYY.MM.dd}"
}
}
} else if "nginx" in [tags] and "error" in [tags] {
mutate {
add_field => {
"[@metadata][target_index]" => "logs-%{[@metadata][beat]}-%{[@metadata][version]}-nginx.error-%{+YYYY.MM.dd}"
}
}
} else {
mutate {
add_field => {
"[@metadata][target_index]" => "logs-%{[@metadata][beat]}-%{[@metadata][version]}-default-%{+YYYY.MM.dd}"
}
}
}
}
output {
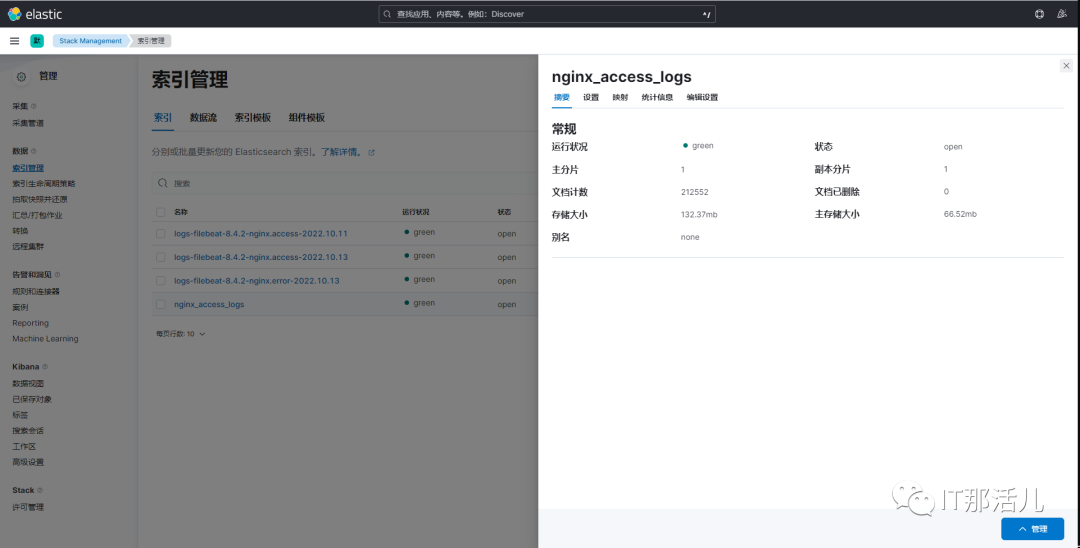
elasticsearch {
hosts => ["http://192.168.80.32:9200","http://192.168.80.33:9200","http://192.168.80.34:9200"]
index => "nginx_access_logs"
manage_template => false
action => "create"
# cacert => "/etc/logstash/certs/elasticsearch-ca.pem"
# user => "logstash_internal"
# password => "logstash123"
}
}
8. 修改nginx配置
修改nginx日志输出为json格式:
$vim /app/nginx/conf/nginx.conf
user nginx nginx;
worker_processes auto;
error_log /app/nginx/logs/error.log;
error_log /app/nginx/logs/error.log notice;
error_log /app/nginx/logs/error.log info;
pid /app/nginx/logs/nginx.pid;
events {
worker_connections 1024;
}
http {
include mime.types;
default_type application/octet-stream;
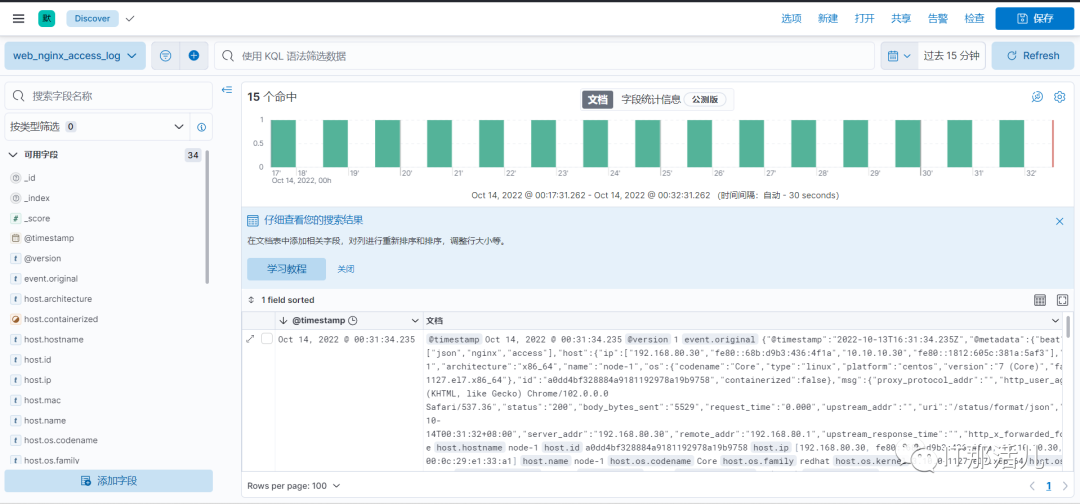
log_format access_json escape=json '{'
'"@timestamp":"$time_iso8601",'
'"server_addr":"$server_addr",'
'"remote_addr":"$remote_addr",'
'"body_bytes_sent":"$body_bytes_sent",'
'"request_time":"$request_time",'
'"upstream_response_time":"$upstream_response_time",'
'"upstream_addr":"$upstream_addr",'
'"uri":"$uri",'
'"http_x_forwarded_for":"$proxy_add_x_forwarded_for",'
'"http_referer":"$http_referer",'
'"proxy_protocol_addr":"$proxy_protocol_addr",'
'"http_user_agent":"$http_user_agent",'
'"status":"$status"'
'}';
access_log /app/nginx/logs/access.log access_json;

本文作者:孙强强(上海新炬中北团队)
本文来源:“IT那活儿”公众号

文章转载自IT那活儿,如果涉嫌侵权,请发送邮件至:contact@modb.pro进行举报,并提供相关证据,一经查实,墨天轮将立刻删除相关内容。
