


作者:马顺华
从事运维管理工作多年,目前就职于某科技有限公司,熟悉运维自动化、OceanBase部署运维、MySQL 运维以及各种云平台技术和产品。并已获得OceanBase认证OBCA、OBCP 证书、OpenGauss社区认证结业证书。OceanBase & 墨天轮第二、三、四、五届技术征文大赛,多次获得 一、二、三 等奖,时常在墨天轮发布原创技术文章,并多次被首页推荐。
OceanBase 可以处理混合负载类型的场景。由于 OceanBase 是基于对等节点的分布式架构,使得它既可以承载高并发&可扩展的 OLTP 任务,还可以在同一套数据引擎中基于 MPP 架构进行 OLAP 的并行计算,无需维护两套数据。在 OceanBase 中,您不但可以在大量在线业务数据上直接进行并行分析,还可以通过 PDML 能力(parallel DML)将批量写入数据的大事务以并发的方式快速安全的执行。 并且,这一切都是在严格保证事务一致性的前提下做到的。
想要上手体验 OceanBase 的 operational OLAP 特性,您可以使用 OceanBase 提供的 OBD 工具。下面让我们先通过使用 OBD 运行 TPCH 测试为例,演示 OceanBase 在 operational OLAP 场景的特点和用法。TPC-H 是一个业界常用的基于决策支持业务的 benchmark,通过一系列在大量数据集上面执行的复杂查询请求,检验数据库系统的分析以及决策支持能力。详细了解可参见 TPC 组织官方网站。
( 2021 年 5 月 20 日,OceanBase 以 1526 万 QphH 的成绩刷新了 TPC-H 世界纪录,并且是唯一一个同时刷新了 TPC-C 以及 TPC-H 纪录的数据库,证明了其能够同时处理在线交易和实时分析两类业务场景能力。详见 TPC-H Result )
一、使用 OBD 工具自动进行 TPCH 测试
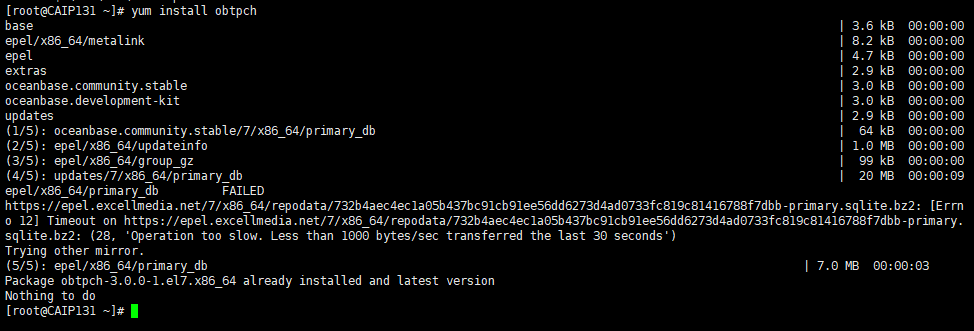
进行TPCH测试您除了可以参考TPC官方网站提供的数据集生成工具,我们也可以使用OBD方便的进行数据集生成、建表、数据导入等工作,并且自动完成22个 SQL 的执行。 在使用 OBD 进行 TPCH 测试前,您需要先在部署了 OceanBase 和 OBD 的节点上安装 obtpch 组件:
[root@CAIP131 ~]# yum install obtpch
base                                                                                                                   | 3.6 kB  00:00:00
epel/x86_64/metalink                                                                                                   | 8.2 kB  00:00:00
epel                                                                                                                   | 4.7 kB  00:00:00
extras                                                                                                                 | 2.9 kB  00:00:00
oceanbase.community.stable                                                                                             | 3.0 kB  00:00:00
oceanbase.development-kit                                                                                              | 3.0 kB  00:00:00
updates                                                                                                                | 2.9 kB  00:00:00
(1/5): oceanbase.community.stable/7/x86_64/primary_db                                                                  |  64 kB  00:00:00
(2/5): epel/x86_64/updateinfo                                                                                          | 1.0 MB  00:00:00
(3/5): epel/x86_64/group_gz                                                                                            |  99 kB  00:00:00
(4/5): updates/7/x86_64/primary_db                                                                                     |  20 MB  00:00:09
epel/x86_64/primary_db         FAILED
https://epel.excellmedia.net/7/x86_64/repodata/732b4aec4ec1a05b437bc91cb91ee56dd6273d4ad0733fc819c81416788f7dbb-primary.sqlite.bz2: [Errno 12] Timeout on https://epel.excellmedia.net/7/x86_64/repodata/732b4aec4ec1a05b437bc91cb91ee56dd6273d4ad0733fc819c81416788f7dbb-primary.sqlite.bz2: (28, 'Operation too slow. Less than 1000 bytes/sec transferred the last 30 seconds')
Trying other mirror.
(5/5): epel/x86_64/primary_db                                                                                     | 7.0 MB  00:00:03
Package obtpch-3.0.0-1.el7.x86_64 already installed and latest version
Nothing to do
[root@CAIP131 ~]#
完成后,我们通过如下命令,就可以启动一个数据集规模为 1GB 的 TPCH 测试了,整个过程包括数据集生成、schema 导入、以及自动运行测试。本文中假设您的测试环境部署和 快速体验 OceanBase 中的步骤一致,如有差别,例如集群名称、密码 安装目录等,请根据具体情况进行调整。注意,请确保您的磁盘空间足够放置数据集文件,以免将空间占满导致系统异常,本例中我们使用 /tmp 目录。
[root@CAIP131 ~]# cd /tmp/
[root@CAIP131 tmp]#

obd test tpch obtest --tenant=test_tenant -s 1 --password='' --remote-tbl-dir=/tmp/tpch1
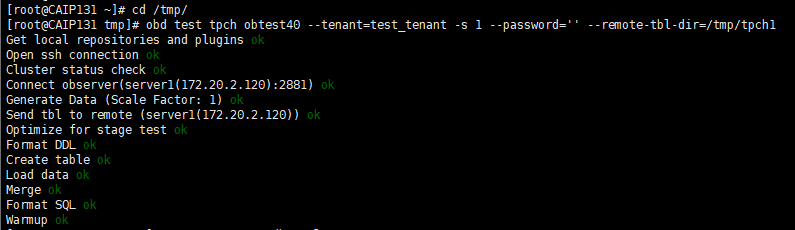
执行上述命令后,OBD 开始执行,可以看到执行过程中的每个步骤:
[root@CAIP131 tmp]# obd test tpch obtest40 --tenant=test_tenant -s 1 --password='' --remote-tbl-dir=/tmp/tpch1
Get local repositories and plugins ok
Open ssh connection ok
Cluster status check ok
Connect observer(server1(172.20.2.120):2881) ok
Generate Data (Scale Factor: 1) ok
Send tbl to remote (server1(172.20.2.120)) ok
Optimize for stage test ok
Format DDL ok
Create table ok
Load data ok
Merge ok
Format SQL ok
Warmup ok
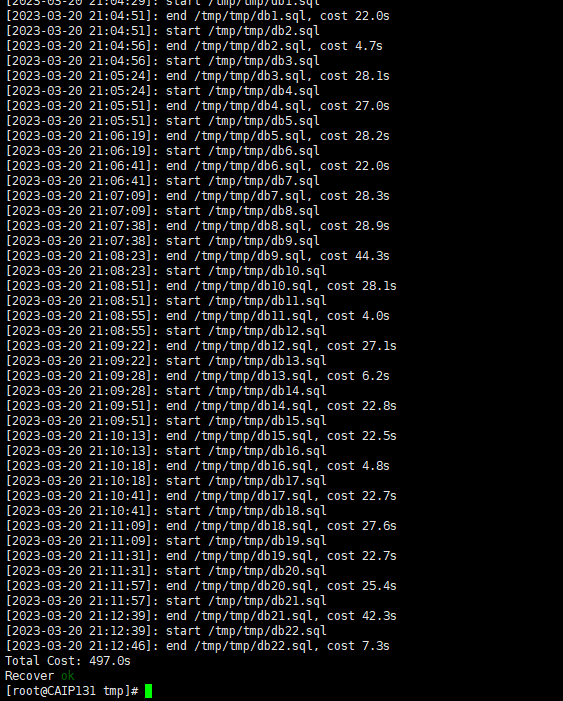
[2023-03-20 21:04:29]: start /tmp/tmp/db1.sql
[2023-03-20 21:04:51]: end /tmp/tmp/db1.sql, cost 22.0s
[2023-03-20 21:04:51]: start /tmp/tmp/db2.sql
[2023-03-20 21:04:56]: end /tmp/tmp/db2.sql, cost 4.7s
[2023-03-20 21:04:56]: start /tmp/tmp/db3.sql
[2023-03-20 21:05:24]: end /tmp/tmp/db3.sql, cost 28.1s
[2023-03-20 21:05:24]: start /tmp/tmp/db4.sql
[2023-03-20 21:05:51]: end /tmp/tmp/db4.sql, cost 27.0s
[2023-03-20 21:05:51]: start /tmp/tmp/db5.sql
[2023-03-20 21:06:19]: end /tmp/tmp/db5.sql, cost 28.2s
[2023-03-20 21:06:19]: start /tmp/tmp/db6.sql
[2023-03-20 21:06:41]: end /tmp/tmp/db6.sql, cost 22.0s
[2023-03-20 21:06:41]: start /tmp/tmp/db7.sql
[2023-03-20 21:07:09]: end /tmp/tmp/db7.sql, cost 28.3s
[2023-03-20 21:07:09]: start /tmp/tmp/db8.sql
[2023-03-20 21:07:38]: end /tmp/tmp/db8.sql, cost 28.9s
[2023-03-20 21:07:38]: start /tmp/tmp/db9.sql
[2023-03-20 21:08:23]: end /tmp/tmp/db9.sql, cost 44.3s
[2023-03-20 21:08:23]: start /tmp/tmp/db10.sql
[2023-03-20 21:08:51]: end /tmp/tmp/db10.sql, cost 28.1s
[2023-03-20 21:08:51]: start /tmp/tmp/db11.sql
[2023-03-20 21:08:55]: end /tmp/tmp/db11.sql, cost 4.0s
[2023-03-20 21:08:55]: start /tmp/tmp/db12.sql
[2023-03-20 21:09:22]: end /tmp/tmp/db12.sql, cost 27.1s
[2023-03-20 21:09:22]: start /tmp/tmp/db13.sql
[2023-03-20 21:09:28]: end /tmp/tmp/db13.sql, cost 6.2s
[2023-03-20 21:09:28]: start /tmp/tmp/db14.sql
[2023-03-20 21:09:51]: end /tmp/tmp/db14.sql, cost 22.8s
[2023-03-20 21:09:51]: start /tmp/tmp/db15.sql
[2023-03-20 21:10:13]: end /tmp/tmp/db15.sql, cost 22.5s
[2023-03-20 21:10:13]: start /tmp/tmp/db16.sql
[2023-03-20 21:10:18]: end /tmp/tmp/db16.sql, cost 4.8s
[2023-03-20 21:10:18]: start /tmp/tmp/db17.sql
[2023-03-20 21:10:41]: end /tmp/tmp/db17.sql, cost 22.7s
[2023-03-20 21:10:41]: start /tmp/tmp/db18.sql
[2023-03-20 21:11:09]: end /tmp/tmp/db18.sql, cost 27.6s
[2023-03-20 21:11:09]: start /tmp/tmp/db19.sql
[2023-03-20 21:11:31]: end /tmp/tmp/db19.sql, cost 22.7s
[2023-03-20 21:11:31]: start /tmp/tmp/db20.sql
[2023-03-20 21:11:57]: end /tmp/tmp/db20.sql, cost 25.4s
[2023-03-20 21:11:57]: start /tmp/tmp/db21.sql
[2023-03-20 21:12:39]: end /tmp/tmp/db21.sql, cost 42.3s
[2023-03-20 21:12:39]: start /tmp/tmp/db22.sql
[2023-03-20 21:12:46]: end /tmp/tmp/db22.sql, cost 7.3s
Total Cost: 497.0s
Recover ok
[root@CAIP131 tmp]#
数据导入完成后,OBD 自动进行 22 个 SQL 的执行,并打印每个 SQL 的耗时以及总耗时。
二、手动体验 Operational OLAP TPCH 测试
1、登录到数据库
通过上一步的自动测试,我们已经获得了一个 TPCH 的测试环境,下面让我们通过手动执行来看看,OceanBase 在 OLAP 方面的能力和特性。 我们先使用 OBClient 登录到数据库中,如果您没有安装 OBClient,使用 MySQL 客户端也是可以的。
[root@CAIP131 tmp]# obclient --h127.0.0.1 -P2883 -uroot@test_tenant -p -Dtest -A -c
Enter password:
Welcome to the OceanBase.  Commands end with ; or \g.
Your OceanBase connection id is 31
Server version: OceanBase_CE 4.0.0.0 (r103000022023011215-05bbad0279302d7274e1b5ab79323a2c915c1981) (Built Jan 12 2023 15:28:27)

Copyright (c) 2000, 2018, OB Corporation Ab and others.

Type 'help;' or '\h' for help. Type '\c' to clear the current input statement.

obclient [test]>
2、租户配置设置
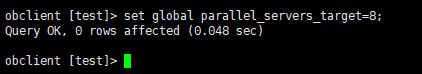
在开始之前,您需要根据 OceanBase 集群和租户的配置,进行并行度的设置,具体大小建议不超过当前租户配置的 CPU 核数的 2 倍。例如您的租户 CPU 最大配置为 8,那么此处建议并行度设置为 16:
obclient [test]> set global parallel_servers_target=8;
Query OK, 0 rows affected (0.048 sec)

obclient [test]>
3、查看表大小
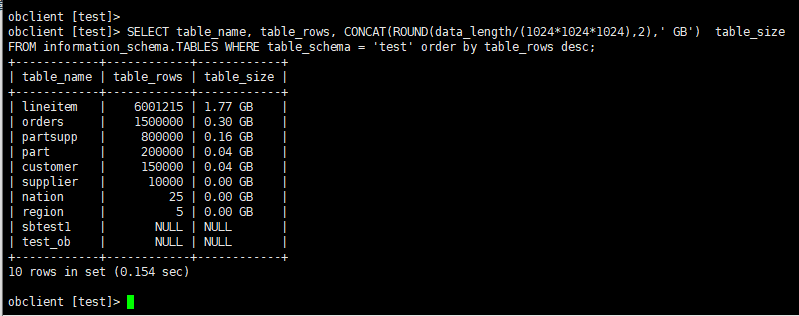
OceanBase 兼容大多数 MySQL 的内部视图,我们可以通过如下查询查看当前环境中表的大小:
obclient [test]>
obclient [test]> SELECT table_name, table_rows, CONCAT(ROUND(data_length/(1024*1024*1024),2),' GB')  table_size FROM information_schema.TABLES WHERE table_schema = 'test' order by table_rows desc;
+------------+------------+------------+
| table_name | table_rows | table_size |
+------------+------------+------------+
| lineitem   |    6001215 | 1.77 GB    |
| orders     |    1500000 | 0.30 GB    |
| partsupp   |     800000 | 0.16 GB    |
| part       |     200000 | 0.04 GB    |
| customer   |     150000 | 0.04 GB    |
| supplier   |      10000 | 0.00 GB    |
| nation     |         25 | 0.00 GB    |
| region     |          5 | 0.00 GB    |
| sbtest1    |       NULL | NULL       |
| test_ob    |       NULL | NULL       |
+------------+------------+------------+
10 rows in set (0.154 sec)

obclient [test]>
4、体验查询能力
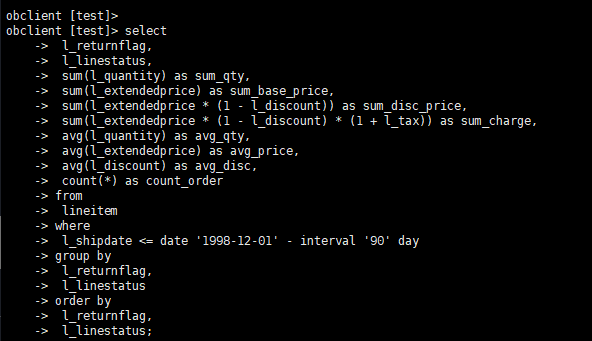
下面我们通过 TPC-H 测试中的 Q1 来体验 OceanBase 查询能力,Q1 查询会在最大的 lineitem 表上,汇总分析指定时间内各类商品的价格、折扣、发货、数量等信息。这个查询对全表数据都会进行读取、并进行分区、排序、聚合等计算。
4.1不开启并发查询
首先,我们在默认不开启并发的情况下执行该查询
select
 l_returnflag,
 l_linestatus,
 sum(l_quantity) as sum_qty,
 sum(l_extendedprice) as sum_base_price,
 sum(l_extendedprice * (1 - l_discount)) as sum_disc_price,
 sum(l_extendedprice * (1 - l_discount) * (1 + l_tax)) as sum_charge,
 avg(l_quantity) as avg_qty,
 avg(l_extendedprice) as avg_price,
 avg(l_discount) as avg_disc,
 count(*) as count_order
from
 lineitem
where
 l_shipdate <= date '1998-12-01' - interval '90' day
group by
 l_returnflag,
 l_linestatus
order by
 l_returnflag,
 l_linestatus;
4.2、查看查询结果
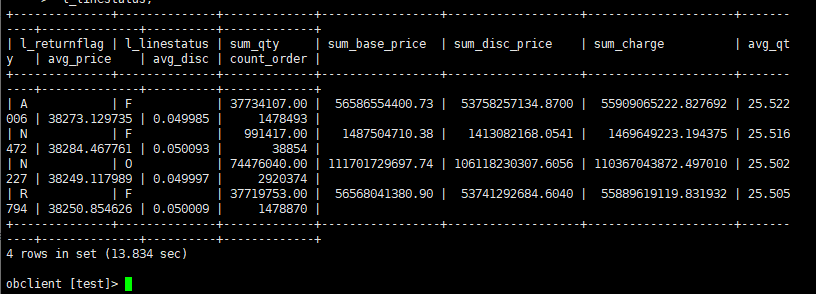
在本例的测试环境中,执行结果如下:
+--------------+--------------+-------------+-----------------+-------------------+---------------------+-----------+--------------+----------+-------------+
| l_returnflag | l_linestatus | sum_qty     | sum_base_price  | sum_disc_price    | sum_charge          | avg_qty   | avg_price    | avg_disc | count_order |
+--------------+--------------+-------------+-----------------+-------------------+---------------------+-----------+--------------+----------+-------------+
| A            | F            | 37734107.00 |  56586554400.73 |  53758257134.8700 |  55909065222.827692 | 25.522006 | 38273.129735 | 0.049985 |     1478493 |
| N            | F            |   991417.00 |   1487504710.38 |   1413082168.0541 |   1469649223.194375 | 25.516472 | 38284.467761 | 0.050093 |       38854 |
| N            | O            | 74476040.00 | 111701729697.74 | 106118230307.6056 | 110367043872.497010 | 25.502227 | 38249.117989 | 0.049997 |     2920374 |
| R            | F            | 37719753.00 |  56568041380.90 |  53741292684.6040 |  55889619119.831932 | 25.505794 | 38250.854626 | 0.050009 |     1478870 |
+--------------+--------------+-------------+-----------------+-------------------+---------------------+-----------+--------------+----------+-------------+
4 rows in set (13.834 sec)

obclient [test]>
5、开启并发查询
5.1执行并行查询
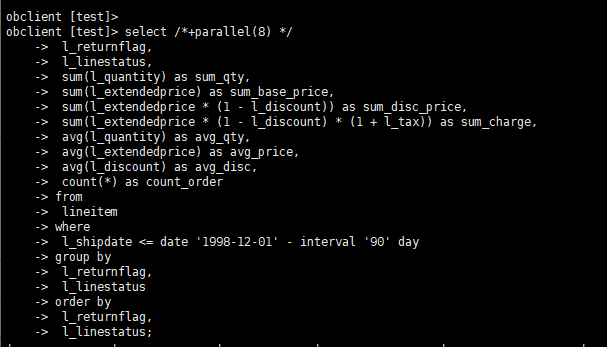
OceanBase 的 Operational OLAP 能力基于一套数据以及执行引擎,无需进行异构的数据同步和维护。下面我们通过添加一个 parallel hint,以并行度为8的方式再次执行这条语句:
select /*+parallel(8) */
 l_returnflag,
 l_linestatus,
 sum(l_quantity) as sum_qty,
 sum(l_extendedprice) as sum_base_price,
 sum(l_extendedprice * (1 - l_discount)) as sum_disc_price,
 sum(l_extendedprice * (1 - l_discount) * (1 + l_tax)) as sum_charge,
 avg(l_quantity) as avg_qty,
 avg(l_extendedprice) as avg_price,
 avg(l_discount) as avg_disc,
 count(*) as count_order
from
 lineitem
where
 l_shipdate <= date '1998-12-01' - interval '90' day
group by
 l_returnflag,
 l_linestatus
order by
 l_returnflag,
 l_linestatus;
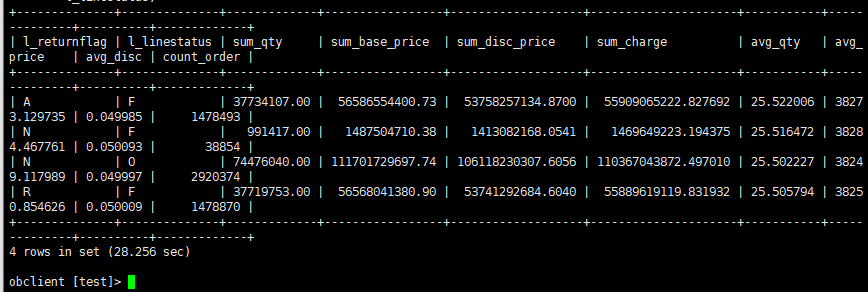
5.2 查看查询结果
在相同的环境和数据集中,执行结果如下:
+--------------+--------------+-------------+-----------------+-------------------+---------------------+-----------+--------------+----------+-------------+
| l_returnflag | l_linestatus | sum_qty     | sum_base_price  | sum_disc_price    | sum_charge          | avg_qty   | avg_price    | avg_disc | count_order |
+--------------+--------------+-------------+-----------------+-------------------+---------------------+-----------+--------------+----------+-------------+
| A            | F            | 37734107.00 |  56586554400.73 |  53758257134.8700 |  55909065222.827692 | 25.522006 | 38273.129735 | 0.049985 |     1478493 |
| N            | F            |   991417.00 |   1487504710.38 |   1413082168.0541 |   1469649223.194375 | 25.516472 | 38284.467761 | 0.050093 |       38854 |
| N            | O            | 74476040.00 | 111701729697.74 | 106118230307.6056 | 110367043872.497010 | 25.502227 | 38249.117989 | 0.049997 |     2920374 |
| R            | F            | 37719753.00 |  56568041380.90 |  53741292684.6040 |  55889619119.831932 | 25.505794 | 38250.854626 | 0.050009 |     1478870 |
+--------------+--------------+-------------+-----------------+-------------------+---------------------+-----------+--------------+----------+-------------+
4 rows in set (28.256 sec)

obclient [test]>
6、查看执行计划
可以看到,对比默认无并发的执行耗时,并行查询下速度提升了将近 6 倍。如果我们通过 explain 命令查看执行计划,也可以看到并行度的展示(第 18 行,1 号算子,dop=8):
===============================================================
|ID|OPERATOR                      |NAME    |EST. ROWS|COST    |
---------------------------------------------------------------
|0 |PX COORDINATOR MERGE SORT     |        |6        |13507125|
|1 | EXCHANGE OUT DISTR           |:EX10001|6        |13507124|
|2 |  SORT                        |        |6        |13507124|
|3 |   HASH GROUP BY              |        |6        |13507107|
|4 |    EXCHANGE IN DISTR         |        |6        |8379337 |
|5 |     EXCHANGE OUT DISTR (HASH)|:EX10000|6        |8379335 |
|6 |      HASH GROUP BY           |        |6        |8379335 |
|7 |       PX BLOCK ITERATOR      |        |5939712  |3251565 |
|8 |        TABLE SCAN            |lineitem|5939712  |3251565 |
===============================================================

Outputs & filters:
-------------------------------------
  0 - output([lineitem.l_returnflag], [lineitem.l_linestatus], [T_FUN_SUM(T_FUN_SUM(lineitem.l_quantity))], [T_FUN_SUM(T_FUN_SUM(lineitem.l_extendedprice))], [T_FUN_SUM(T_FUN_SUM(lineitem.l_extendedprice * 1 - lineitem.l_discount))], [T_FUN_SUM(T_FUN_SUM(lineitem.l_extendedprice * 1 - lineitem.l_discount * 1 + lineitem.l_tax))], [T_FUN_SUM(T_FUN_SUM(lineitem.l_quantity)) / cast(T_FUN_COUNT_SUM(T_FUN_COUNT(lineitem.l_quantity)), DECIMAL(20, 0))], [T_FUN_SUM(T_FUN_SUM(lineitem.l_extendedprice)) / cast(T_FUN_COUNT_SUM(T_FUN_COUNT(lineitem.l_extendedprice)), DECIMAL(20, 0))], [T_FUN_SUM(T_FUN_SUM(lineitem.l_discount)) / cast(T_FUN_COUNT_SUM(T_FUN_COUNT(lineitem.l_discount)), DECIMAL(20, 0))], [T_FUN_COUNT_SUM(T_FUN_COUNT(*))]), filter(nil), sort_keys([lineitem.l_returnflag, ASC], [lineitem.l_linestatus, ASC])
  1 - output([lineitem.l_returnflag], [lineitem.l_linestatus], [T_FUN_SUM(T_FUN_SUM(lineitem.l_quantity))], [T_FUN_SUM(T_FUN_SUM(lineitem.l_extendedprice))], [T_FUN_SUM(T_FUN_SUM(lineitem.l_extendedprice * 1 - lineitem.l_discount))], [T_FUN_SUM(T_FUN_SUM(lineitem.l_extendedprice * 1 - lineitem.l_discount * 1 + lineitem.l_tax))], [T_FUN_COUNT_SUM(T_FUN_COUNT(*))], [T_FUN_SUM(T_FUN_SUM(lineitem.l_quantity)) / cast(T_FUN_COUNT_SUM(T_FUN_COUNT(lineitem.l_quantity)), DECIMAL(20, 0))], [T_FUN_SUM(T_FUN_SUM(lineitem.l_extendedprice)) / cast(T_FUN_COUNT_SUM(T_FUN_COUNT(lineitem.l_extendedprice)), DECIMAL(20, 0))], [T_FUN_SUM(T_FUN_SUM(lineitem.l_discount)) / cast(T_FUN_COUNT_SUM(T_FUN_COUNT(lineitem.l_discount)), DECIMAL(20, 0))]), filter(nil), dop=8
  2 - output([lineitem.l_returnflag], [lineitem.l_linestatus], [T_FUN_SUM(T_FUN_SUM(lineitem.l_quantity))], [T_FUN_SUM(T_FUN_SUM(lineitem.l_extendedprice))], [T_FUN_SUM(T_FUN_SUM(lineitem.l_extendedprice * 1 - lineitem.l_discount))], [T_FUN_SUM(T_FUN_SUM(lineitem.l_extendedprice * 1 - lineitem.l_discount * 1 + lineitem.l_tax))], [T_FUN_COUNT_SUM(T_FUN_COUNT(*))], [T_FUN_SUM(T_FUN_SUM(lineitem.l_quantity)) / cast(T_FUN_COUNT_SUM(T_FUN_COUNT(lineitem.l_quantity)), DECIMAL(20, 0))], [T_FUN_SUM(T_FUN_SUM(lineitem.l_extendedprice)) / cast(T_FUN_COUNT_SUM(T_FUN_COUNT(lineitem.l_extendedprice)), DECIMAL(20, 0))], [T_FUN_SUM(T_FUN_SUM(lineitem.l_discount)) / cast(T_FUN_COUNT_SUM(T_FUN_COUNT(lineitem.l_discount)), DECIMAL(20, 0))]), filter(nil), sort_keys([lineitem.l_returnflag, ASC], [lineitem.l_linestatus, ASC])
  3 - output([lineitem.l_returnflag], [lineitem.l_linestatus], [T_FUN_SUM(T_FUN_SUM(lineitem.l_quantity))], [T_FUN_SUM(T_FUN_SUM(lineitem.l_extendedprice))], [T_FUN_SUM(T_FUN_SUM(lineitem.l_extendedprice * 1 - lineitem.l_discount))], [T_FUN_SUM(T_FUN_SUM(lineitem.l_extendedprice * 1 - lineitem.l_discount * 1 + lineitem.l_tax))], [T_FUN_COUNT_SUM(T_FUN_COUNT(lineitem.l_quantity))], [T_FUN_COUNT_SUM(T_FUN_COUNT(lineitem.l_extendedprice))], [T_FUN_SUM(T_FUN_SUM(lineitem.l_discount))], [T_FUN_COUNT_SUM(T_FUN_COUNT(lineitem.l_discount))], [T_FUN_COUNT_SUM(T_FUN_COUNT(*))]), filter(nil),
      group([lineitem.l_returnflag], [lineitem.l_linestatus]), agg_func([T_FUN_SUM(T_FUN_SUM(lineitem.l_quantity))], [T_FUN_SUM(T_FUN_SUM(lineitem.l_extendedprice))], [T_FUN_SUM(T_FUN_SUM(lineitem.l_extendedprice * 1 - lineitem.l_discount))], [T_FUN_SUM(T_FUN_SUM(lineitem.l_extendedprice * 1 - lineitem.l_discount * 1 + lineitem.l_tax))], [T_FUN_COUNT_SUM(T_FUN_COUNT(*))], [T_FUN_COUNT_SUM(T_FUN_COUNT(lineitem.l_quantity))], [T_FUN_COUNT_SUM(T_FUN_COUNT(lineitem.l_extendedprice))], [T_FUN_SUM(T_FUN_SUM(lineitem.l_discount))], [T_FUN_COUNT_SUM(T_FUN_COUNT(lineitem.l_discount))])
  4 - output([lineitem.l_returnflag], [lineitem.l_linestatus], [T_FUN_SUM(lineitem.l_quantity)], [T_FUN_SUM(lineitem.l_extendedprice)], [T_FUN_SUM(lineitem.l_extendedprice * 1 - lineitem.l_discount)], [T_FUN_SUM(lineitem.l_extendedprice * 1 - lineitem.l_discount * 1 + lineitem.l_tax)], [T_FUN_COUNT(lineitem.l_quantity)], [T_FUN_COUNT(lineitem.l_extendedprice)], [T_FUN_SUM(lineitem.l_discount)], [T_FUN_COUNT(lineitem.l_discount)], [T_FUN_COUNT(*)]), filter(nil)
  5 - (#keys=2, [lineitem.l_returnflag], [lineitem.l_linestatus]), output([lineitem.l_returnflag], [lineitem.l_linestatus], [T_FUN_SUM(lineitem.l_quantity)], [T_FUN_SUM(lineitem.l_extendedprice)], [T_FUN_SUM(lineitem.l_extendedprice * 1 - lineitem.l_discount)], [T_FUN_SUM(lineitem.l_extendedprice * 1 - lineitem.l_discount * 1 + lineitem.l_tax)], [T_FUN_COUNT(lineitem.l_quantity)], [T_FUN_COUNT(lineitem.l_extendedprice)], [T_FUN_SUM(lineitem.l_discount)], [T_FUN_COUNT(lineitem.l_discount)], [T_FUN_COUNT(*)]), filter(nil), dop=8
  6 - output([lineitem.l_returnflag], [lineitem.l_linestatus], [T_FUN_SUM(lineitem.l_quantity)], [T_FUN_SUM(lineitem.l_extendedprice)], [T_FUN_SUM(lineitem.l_extendedprice * 1 - lineitem.l_discount)], [T_FUN_SUM(lineitem.l_extendedprice * 1 - lineitem.l_discount * 1 + lineitem.l_tax)], [T_FUN_COUNT(lineitem.l_quantity)], [T_FUN_COUNT(lineitem.l_extendedprice)], [T_FUN_SUM(lineitem.l_discount)], [T_FUN_COUNT(lineitem.l_discount)], [T_FUN_COUNT(*)]), filter(nil),
      group([lineitem.l_returnflag], [lineitem.l_linestatus]), agg_func([T_FUN_SUM(lineitem.l_quantity)], [T_FUN_SUM(lineitem.l_extendedprice)], [T_FUN_SUM(lineitem.l_extendedprice * 1 - lineitem.l_discount)], [T_FUN_SUM(lineitem.l_extendedprice * 1 - lineitem.l_discount * 1 + lineitem.l_tax)], [T_FUN_COUNT(*)], [T_FUN_COUNT(lineitem.l_quantity)], [T_FUN_COUNT(lineitem.l_extendedprice)], [T_FUN_SUM(lineitem.l_discount)], [T_FUN_COUNT(lineitem.l_discount)])
  7 - output([lineitem.l_returnflag], [lineitem.l_linestatus], [lineitem.l_quantity], [lineitem.l_extendedprice], [lineitem.l_discount], [lineitem.l_extendedprice * 1 - lineitem.l_discount], [lineitem.l_extendedprice * 1 - lineitem.l_discount * 1 + lineitem.l_tax]), filter(nil)
  8 - output([lineitem.l_returnflag], [lineitem.l_linestatus], [lineitem.l_quantity], [lineitem.l_extendedprice], [lineitem.l_discount], [lineitem.l_extendedprice * 1 - lineitem.l_discount], [lineitem.l_extendedprice * 1 - lineitem.l_discount * 1 + lineitem.l_tax]), filter([lineitem.l_shipdate <= ?]),
      access([lineitem.l_shipdate], [lineitem.l_returnflag], [lineitem.l_linestatus], [lineitem.l_quantity], [lineitem.l_extendedprice], [lineitem.l_discount], [lineitem.l_tax]), partitions(p[0-15])
本文中的例子使用单节点环境部署,值得特别说明的是,OceanBase 的并行执行框架最大的特点是还可以将大量数据的分析查询以多节点并发执行的方式进行分析,例如一张表包含上亿行数据,分布在多个 OceanBase 节点上,当进行分析查询时,OceanBase 的分布式执行框架可以生成一个分布式并行执行计划,利用多个节点的资源进行分析,因此具备很好的扩展性,同时针对并行的设置还可以在 SQL,会话,表上多个维度进行设置。
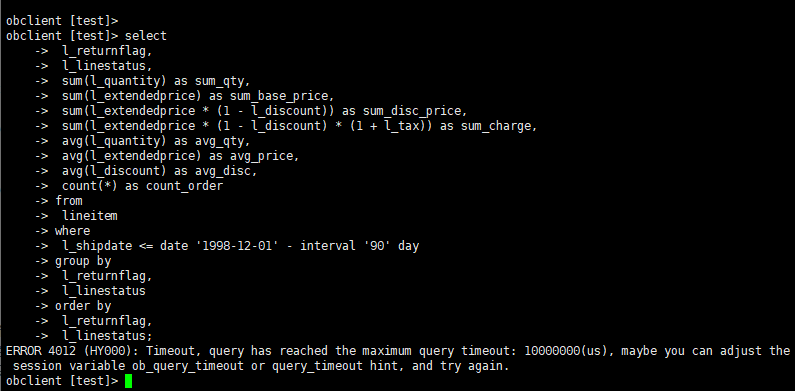
报错处理办法
ERROR 4012 (HY000): Timeout, query has reached the maximum query timeout: 10000000(us), maybe you can adjust the session variable ob_query_timeout or query_timeout hint, and try again.
obclient [test]>
查询超时变量
OceanBase 数据库的查询超时功能用于避免长时间不返回的查询长期占用工作线程资源以及可能占用 CPU 资源。
OceanBase 数据库租户内部执行查询的工作线程数跟租户的 CPU 个数相关,所以工作线程是很稀有的资源。如果查询长时间不返回,就会一直占用此工作线程资源。
OceanBase 数据库的查询超时时间默认由租户变量 ob_query_timeout 控制,默认值是 100000000(单位微秒)。当查询时间超过该变量值后,会返回错误 -4012(HY000): Timeout。
超时变量的默认值对于 OLTP 类业务来说是合理的,但是对于 OLAP 类业务就不一定适用,这种情况下,用户可以选择在会话级别调整租户超时变量的值,或者使用 SQL Hint 设置查询超时时间。
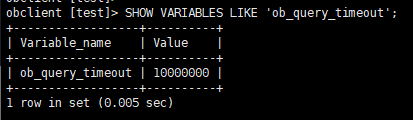
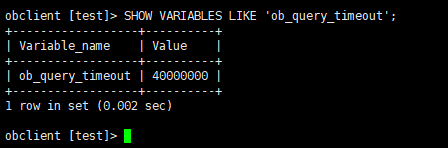
1:查看当前查询超时时间
obclient> SHOW VARIABLES LIKE ‘ob_query_timeout’;
±-----------------±---------+
| Variable_name | Value |
±-----------------±---------+
| ob_query_timeout | 60000000 |
±-----------------±---------+
1 row in set
2:在会话级别调整租户的查询超时时间
obclient> SET SESSION ob_query_timeout=10000000;
Query OK, 0 rows affected
obclient> SELECT SLEEP(11);
ERROR 4012 (HY000): Timeout
示例 3:使用 SQL Hint 设置查询超时时间
obclient> SELECT /*+ QUERY_TIMEOUT(100000000) */ SLEEP(11);
±----------+
| SLEEP(11) |
±----------+
| 0 |
±----------+
1 row in set
