


pg_lock_tracer实现数据库服务可观测

引子
上一篇PostgreSQL + eBPF实现数据库服务可观测 发了之后有小伙伴表示搭建eBPF的环境比较麻烦,尤其是编译BCC的时候遇到了很多问题。的确,之前主要是从原理上介绍eBPF如何结合PostgreSQL结合的,虽然使用了相对简单的使用Python编写观测脚本,并没有使用C来编写,但是确实还是有一定门槛。因此本文将介绍一种更加简单且容易上手的观测方式。
后注:今天早上看到熊老师在他的公众号上发了一篇文章《使用eBPF提升可观测性》,非常荣幸能为像熊老师这样的资深DBA提供一些灵感,同时我也在考虑我这边文章是不是还有写的必要,因为熊老师吧pg_lock_tracer已经说的很清晰了。但我当时我这篇文章已经写了一大半了,想想还是把它完成吧。——里面部分内容作了删减可以参考熊老师的文章。
概述
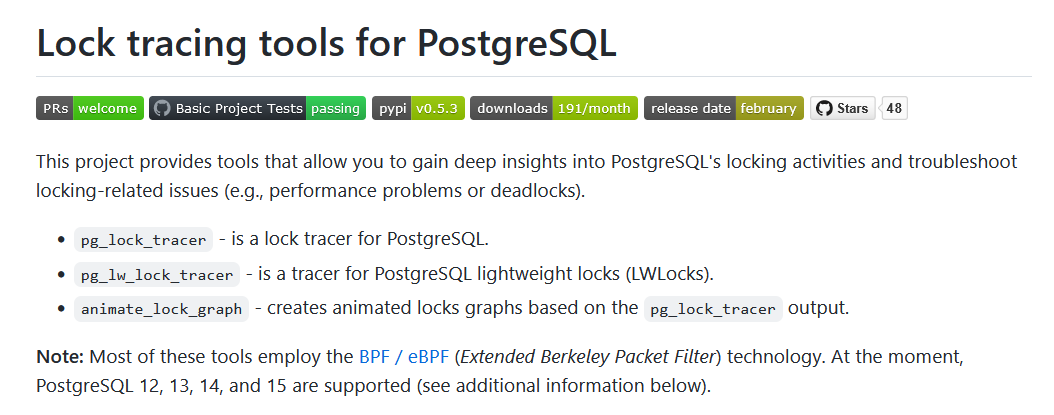
pg_lock_tracer是一个开源项目,虽然它未必能用到生产上,但它们非常酷,我认为它们展示了如何使用eBPF监视Postgres的前景。pg_lock_tracer的灵感来自于pg_locks表所展示的内容,即当前由哪个Postgres连接持有哪些锁。这里的区别在于pg_lock_tracer会查看每个锁定调用并随时间进行总结。显然,这会带来一些额外的开销,因此这不一定是您一直在生产系统上运行的东西,但如果您面临无法通过其他方式进行调试的问题,这可能是有意义的。
Note:为什么说pg_lock_tracer不适合运行在生产上,原因是需要PostgreSQL开启Dtrace选项,虽然这个选项开启并不会后太多性能损耗,但是如果通过Dtrace对PostgreSQL进行观测时,还是会对性能产生影响。
pg_lock_tracer可以做什么
pg_lock_tracer会查看有关获取锁的统计信息,例如:
- 锁的数量
- 锁的类型
- 获取锁的延迟
https://github.com/jnidzwetzki/pg-lock-tracer
环境搭建
python环境
$ sudo apt install python3
$ python3 --version
Python 3.10.6
依赖安装
$ cd pg-lock-tracer
$ python3 -m venv .venv
$ pip install bcc
$ pip install pg-lock-tracer
验证
root@LAPTOP-4OF1323N:/home/frank/github/pg-lock-tracer# pg_lock_tracer -h
usage: pg_lock_tracer [-h] [-V] [-v] [-j] -p PID [PID ...] -x PATH [-r [OIDResolver ...]] [-s [{DEADLOCK,LOCK,UNLOCK} ...]]
                      [-t [{TRANSACTION,QUERY,TABLE,LOCK,INVALIDATION,ERROR} ...]] [-o OUTPUT_FILE] [--statistics] [-d]

options:
  -h, --help            show this help message and exit
  -V, --version         show program's version number and exit
  -v, --verbose         be verbose
  -j, --json            generate output as JSON data
  -p PID [PID ...], --pid PID [PID ...]
                        the pid(s) to trace
  -x PATH, --exe PATH   path to binary
  -r [OIDResolver ...], --oid-resolver [OIDResolver ...]
                        OID resolver for a PID. The resolver has to be specified in format <PID:database-url>
  -s [{DEADLOCK,LOCK,UNLOCK} ...], --stacktrace [{DEADLOCK,LOCK,UNLOCK} ...]
                        print stacktrace on every of these events
  -t [{TRANSACTION,QUERY,TABLE,LOCK,INVALIDATION,ERROR} ...], --trace [{TRANSACTION,QUERY,TABLE,LOCK,INVALIDATION,ERROR} ...]
                        events to trace (default: All events are traced)
  -o OUTPUT_FILE, --output OUTPUT_FILE
                        write the trace into output file
  --statistics          print lock statistics
  -d, --dry-run         compile and load the BPF program but exit afterward

usage examples:
# Trace use binary '/home/jan/postgresql-sandbox/bin/REL_15_1_DEBUG/bin/postgres' for tracing and trace pid 1234
pg_lock_tracer -x /home/jan/postgresql-sandbox/bin/REL_15_1_DEBUG/bin/postgres -p 1234

# Trace two PIDs
pg_lock_tracer -x /home/jan/postgresql-sandbox/bin/REL_15_1_DEBUG/bin/postgres -p 1234 -p 5678

# Be verbose
pg_lock_tracer -x /home/jan/postgresql-sandbox/bin/REL_15_1_DEBUG/bin/postgres -p 1234 -v

# Use the given db connection to access the catalog of PID 1234 to resolve OIDs
pg_lock_tracer -x /home/jan/postgresql-sandbox/bin/REL_15_1_DEBUG/bin/postgres -p 1234 -r 1234:psql://jan@localhost/test2

# Output in JSON format
pg_lock_tracer -x /home/jan/postgresql-sandbox/bin/REL_15_1_DEBUG/bin/postgres -p 1234 -j

# Print stacktrace on deadlock
pg_lock_tracer -x /home/jan/postgresql-sandbox/bin/REL_15_1_DEBUG/bin/postgres -p 1234 -s DEADLOCK

# Print stacktrace for locks and deadlocks
pg_lock_tracer -x /home/jan/postgresql-sandbox/bin/REL_15_1_DEBUG/bin/postgres -p 1234 -s LOCK DEADLOCK

# Trace only Transaction and Query related events
pg_lock_tracer -x /home/jan/postgresql-sandbox/bin/REL_15_1_DEBUG/bin/postgres -p 1234 -t TRANSACTION QUERY

# Write the output into file 'trace'
pg_lock_tracer -x /home/jan/postgresql-sandbox/bin/REL_15_1_DEBUG/bin/postgres -p 1234 -o trace

# Show statistics about locks
pg_lock_tracer -x /home/jan/postgresql-sandbox/bin/REL_15_1_DEBUG/bin/postgres -p 1234 --statistics
观测演示
这部分大家还是参考《使用eBPF提升可观测性》这篇文章吧,
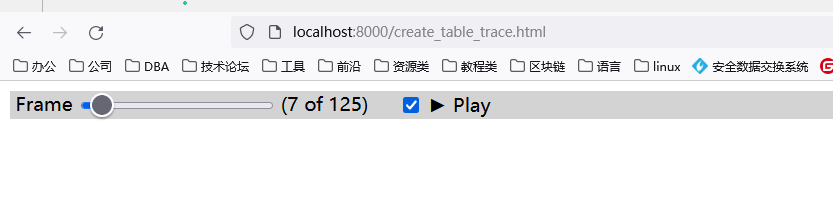
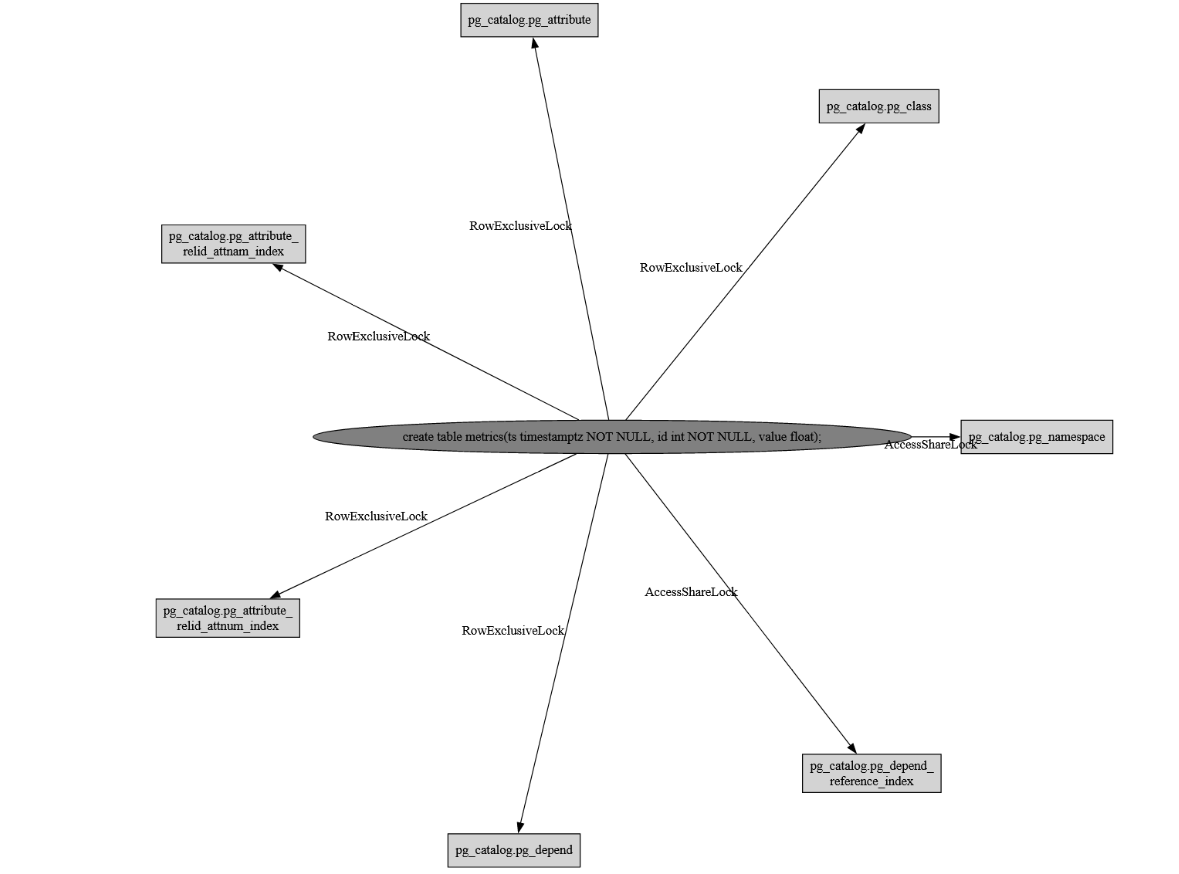
这里补充一下animate_lock_graph工具的使用。
- 在使用pg_lock_tracer 工具时加上 -j参数,生成json格式的输出,然后通过以下命令生成可视化观测:
animate_lock_graph.py -i test_trace.json -o test.htm
- 进入test.htm所在目录,通过以下命令提供静态web服务:
python3 -m http.server
Serving HTTP on 0.0.0.0 port 8000 (http://0.0.0.0:8000/) ...
- 打开浏览器输入:http://localhost:8000/test.html 会以动画的形式展示锁的状态。
总结
可观测技术已经在多个领域得到广泛的应用,希望能够通过我的几篇帖子对数据库领域可观测技术提供一些启示,欣喜的是大佬们经开始关注和应用了eBPF技术了,后续如果有比较好的场景还会针对性的发一些文章。
附录
以下几篇文章供大家参考。
