


这是一则来自客户现场的真实案例,客户现场人员在通过PL/SQL Developer客户端工具创建索引时出现ORA-04030错误,导致索引创建失败。但是通过SQL*Plus重新执行创建索引语句却能够成功。为什么会出现这种错误和执行差异呢?请跟随我们的思路来一步步地了解这个案例的解析过程。
11.1 聚集数据的信息采集和分析
首先,了解ORA-04030错误的原因。ORA-04030错误引起的原因大概有以下几种情况。
(1)是否有足够的可用内存?
查看操作系统内存使用情况。
+-topas_nmon--r=Resources--------Host=gisdata2-------Refresh=2 secs---10:03.50------------+

| Memory ---------------------------------------------------------------------------|

|     Physical PageSpace |    pages/sec In   Out | FileSystemCache      |

|% Used    87.7%   2.6% | to Paging Space  0.5  0.0 | (numperm) 4.6%      |

**|% Free    12.3%   97.4%**  | to File System  0.0  0.0 | Process  66.1%      |

|MB Used  55450.2MB  523.7MB | Page Scans    0.0    | System  17.0%      |

**|MB Free  7781.6MB 19956.3MB** | Page Cycles    0.0    | Free   12.3%      |

|Total(MB) 63231.9MB 20480.0MB | Page Steals    0.0    |      ------     |

|                 | Page Faults  2110.3    | Total  100.0%      |

|--------------------------------------------------------- | numclient 4.6%     |

|Min/Maxperm   3065MB( 5%) 9195MB( 15%) <--% of RAM    | maxclient 15.0%     |

|Min/Maxfree  3000  4000    Total Virtual  81.7GB   | User   67.7%      |

|Min/Maxpgahead  2   8  Accessed Virtual  50.8GB 62.2%| Pinned  19.8%     |

|                               | lruable pages  15692064.0|

|-----------------------------------------------------------------------------------|
查看当时出故障的服务器资源,可以看到剩余内存还有7.7GB左右,说明在操作系统层面还有足够多的可用内存。
(2)是否设置了Oracle的限制?
查看数据库中与PGA相关的设置。
SQL> show parameter PGA

NAME                 TYPE               VALUE

------------------------------------ ----------------- ------------------------------

**pga_aggregate_target         big integer           8400M**

SQL> select * from v$pgastat;

NAME                                  VALUE UNIT

------------------------------------------------------------- ---------- ------------

aggregate PGA target parameter                  8808038400 bytes

aggregate PGA auto target                     7288095744 bytes

global memory bound                        880803840 bytes

total PGA inuse                          720201728 bytes

total PGA allocated                        985562112 bytes

**maximum PGA allocated                      2692780032 bytes  ---**实际分配最大内存 **2568.03516MB**

total freeable PGA memory                     163905536 bytes

process count                              414

max processes count                           529

PGA memory freed back to OS                   2.4854E+11 bytes

total PGA used for auto workareas                 10177536 bytes

maximum PGA used for auto workareas                642154496 bytes

total PGA used for manual workareas                    0 bytes

maximum PGA used for manual workareas                537600 bytes

over allocation count                           0

bytes processed                         5.7321E+11 bytes

extra bytes read/written                     2125827072 bytes

cache hit percentage                         99.63 percent

recompute count (total)                        61401

SQL> SELECT x.ksppinm NAME, y.ksppstvl VALUE, x.ksppdesc describ

 2 FROM SYS.x$ksppi x, SYS.x$ksppcv y

 3 WHERE x.indx = y.indx

 4 AND x.ksppinm LIKE '%_pga_max_size%';

NAME              VALUE        DESCRIB

------------------------------ -----------------------------------------------------

**_pga_max_size     1761607680    Maximum size of the PGA memory for one process**

SQL> SELECT x.ksppinm NAME, y.ksppstvl VALUE, x.ksppdesc describ

 2 FROM SYS.x$ksppi x, SYS.x$ksppcv y

 3 WHERE x.indx = y.indx

 4 AND x.ksppinm LIKE '%_smm_max_size%';

NAME              VALUE        DESCRIB

------------------------------ ------ ------------------------------------------------

**_smm_max_size        860160       maximum work area size in auto mode (serial)**
从上面的内容可以看到PGA设置的大小为8400M,根据单个会话使用PGA的期望尺寸(也可以认为是实际分配的最大尺寸)计算公式是:min(5%pga_aggregate_target,50%_pga_max_size, _smm_max_size),可以简单计算下min(5%*8400M,50%1680M,840M)=420M(其中_pga_max_size的单位为bytes,_smm_max_size的单位为kb),即单个会话能使用PGA的期望尺寸为420M,那报错的会话是否超过了该限制呢?
查看ORA-04030报错的trace文件如下所示。
TOP 10 MEMORY USES FOR THIS PROCESS

\---------------------------------------

98% 109 MB, 1797 chunks: "permanent memory     " SQL

     sort subheap  ds=1108b67f0 dsprt=11048a508

 1% 1493 KB, 1779 chunks: "free memory        "

     session heap  ds=11047a818 dsprt=11019eae0

 0% 193 KB, 26 chunks: "permanent memory     "

     pga heap    ds=110072eb0 dsprt=0

 0%  82 KB,  6 chunks: "frame segment       " SQL

     kxs-heap-f   ds=11048a8c8 dsprt=11047a818

 0%  45 KB,  4 chunks: "permanent memory     "

     session heap  ds=11047a818 dsprt=11019eae0

 0%  35 KB, 11 chunks: "kzctxhugi2        "

     session heap  ds=11047a818 dsprt=11019eae0

 0%  33 KB,  1 chunk : "free memory        "

     top call heap  ds=11019e8c0 dsprt=0

 0%  24 KB, 11 chunks: "koh-kghu session heap   "

     session heap  ds=11047a818 dsprt=11019eae0

 0%  22 KB,  1 chunk : "Fixed Uga         "

     pga heap    ds=110072eb0 dsprt=0

 0%  20 KB,  5 chunks: "kxsFrame4kPage      "

     session heap  ds=11047a818 dsprt=11019eae0


=======================================

PRIVATE MEMORY SUMMARY FOR THIS PROCESS

\---------------------------------------

******************************************************

**PRIVATE HEAP SUMMARY DUMP**

**111 MB total:**

  111 MB commented, 194 KB permanent

  45 KB free (0 KB in empty extents),

   111 MB,  1 heap:  "session heap  "

\------------------------------------------------------

Summary of subheaps at depth 1

111 MB total:

  109 MB commented, 55 KB permanent

 1513 KB free (1 KB in empty extents),

   2 KB uncommented freeable with mark,   110 MB,  1 heap:  "kxs-heap-w  "  1490 KB free held

\------------------------------------------------------

Summary of subheaps at depth 2

109 MB total:

  109 MB commented, 10 KB permanent

  14 KB free (4 KB in empty extents),

   0 KB uncommented freeable with mark,   109 MB,  1 heap:  "sort subheap  "

\------------------------------------------------------

Summary of subheaps at depth 3

109 MB total:

   0 KB commented, 109 MB permanent

   2 KB free (0 KB in empty extents),

==========================================

INSTANCE-WIDE PRIVATE MEMORY USAGE SUMMARY

\-------------------------

Top 10 processes:

\-------------------------

(percentage is of 693 MB total allocated memory)

**16% pid 168: 111 MB used of 111 MB allocated <= CURRENT PROC**

 6% pid 3: 43 MB used of 43 MB allocated

 2% pid 24: 402 KB used of 12 MB allocated (12 MB freeable)

 2% pid 33: 532 KB used of 12 MB allocated (11 MB freeable)

 2% pid 7: 11 MB used of 11 MB allocated

 2% pid 8: 11 MB used of 11 MB allocated

 2% pid 9: 11 MB used of 11 MB allocated

 2% pid 10: 11 MB used of 11 MB allocated

 2% pid 11: 11 MB used of 11 MB allocated

 2% pid 12: 11 MB used of 11 MB allocated
从以上的trace文件中可以看到,报错的进程实际分配的进程只有111MB,远远未达到420MB,说明并非是由于Oracle自身的限制引起的ORA-04030报错。
3)哪个进程需要的内存过多?
上一个是否是由于Oracle自身限制引起的解释中,已经可以从trace文件中看到,消耗最多内存的进程就是报ORA-04030的进程,消耗的内存为110MB,并未发现其他更消耗内存的进程。
4)是否设置了操作系统限制?
查看操作系统限制,Oracle用户的限制。
$ ulimit -a

time(seconds)    unlimited

file(blocks)     unlimited

data(kbytes)     unlimited

stack(kbytes)    4194304

memory(kbytes)    unlimited

coredump(blocks)   unlimited

nofiles(descriptors) unlimited

threads(per process) unlimited

processes(per user) unlimited
root用户的限制。
gisdata2@root[/]ulimit -a

time(seconds)    unlimited

file(blocks)     unlimited

**data(kbytes)     131072**

stack(kbytes)    32768

memory(kbytes)    unlimited

coredump(blocks)   unlimited

nofiles(descriptors) unlimited

threads(per process) unlimited

processes(per user) unlimited
从上面root和oracle的limit限制来看,root用户的data(kbytes)的限定值得关注,该属性的意义是soft data segment size in blocks(进程数据段大小限制)。
11.2 聚焦疑点的跟踪测试与验证
现在做一个反向测试:利用SQLPlus工具创建索引,创建成功。问题来了,为何SQLPlus会成功,PL/SQL Developer却会失败?通过PL/SQL Developer工具创建索引时报ORA-04030错误,但是通过SQLPus创建却能成功,两者除了使用的工具不同,还有就是连接的方式不同(PL/SQL Developer是通过监听程序建立的进程连接,而SQLPlus是在数据库服务器上直接创建创建的连接,绕过了监听程序建立的进程)。从连接工具和方式的不同得到了不一样的结果,如何来验证到底是连接工具的问题还是连接方式的引起的报错?由于PL/SQL Developer只能通过监听的方式进行连接,但是SQLPlus可以通过监听或则直接连接两种方式进行,所以先对连接方式进行测试。通过SQLPlus以tnsnames.ora标签名的方式通过监听进行连接,并执行创建索引报错的语句,发现错误依然存在,但是如果不通过监听而直接连接是不会报错的,说明跟是否通过监听进行连接有很大的关系。
为何会受监听的影响?
在Oracle RAC环境中,由于crs的启停是通过root用户进行的。
gisdata2@root[/]ps -ef|grep init

  root     1    0  0  Aug 31   - 18:24 /etc/init

  root 5046686    1  0  Jul 18   - 0:00 /bin/sh /etc/init.crsd run

  root 5702082 27066830  0  Jul 18   - 0:00 /bin/sh /etc/init.cssd oclsomon

  root 6554098 27066830  0  Jul 18   - 0:00 /bin/sh /etc/init.cssd daemon

  root 24969600    1  0  Jul 18   - 0:00 /bin/sh /etc/init.evmd run

  root 27066830    1  1  Jul 18   - 8:07 /bin/sh /etc/init.cssd fatal

  root 40108312 18940178  0 10:57:45 pts/1 0:00 grep init
所以在crs会继承root用户的limit属性,当通过crs或则srvctl命令启动监听时,也会继承root用户相应的limit属性,即data(kbytes)为131072。如何验证该推断?
现在通过监听的形式进行连接。
**$ SQLplus sys/password@gissc2 as sysdba**

SQL*Plus: Release 10.2.0.5.0 - Production on Mon Jul 20 17:20:02 2015

Copyright (c) 1982, 2010, Oracle.  All Rights Reserved.


SQL> select * from v$mystat where rownum<2;

    SID STATISTIC#   VALUE

---------- ---------- ----------

   1427     0     1

SQL> select spid from v$process where addr =(select paddr from v$session where sid=1427);

SPID

\------------

**10158446         -----**该连接的操作系统进程号
通过dbx工具查看该进程的limit信息:
**$ dbx -a 10158446**

Waiting to attach to process 10158446 ...

Successfully attached to oracle.

warning: Directory containing oracle could not be determined.

Apply 'use' command to initialize source path.


Type 'help' for help.

reading symbolic information ...

stopped in read at 0x90000000002e294 ($t1)

0x90000000002e294 (read+0x274) e8410028     ld  r2,0x28(r1)

 (dbx) proc rlimit

rlimit name:     rlimit_cur        rlimit_max    (units)

 RLIMIT_CPU:     (unlimited)       (unlimited)    sec

 RLIMIT_FSIZE:    (unlimited)       (unlimited)    bytes

 **RLIMIT_DATA:     134217728       (unlimited)    bytes**

 RLIMIT_STACK:     33554432       4294967296    bytes

 RLIMIT_CORE:    (unlimited)       (unlimited)    bytes

 RLIMIT_RSS:     (unlimited)       (unlimited)    bytes

 RLIMIT_AS:     (unlimited)       (unlimited)    bytes

 RLIMIT_NOFILE:      65534          65536    descriptors

 RLIMIT_THREADS:   (unlimited)       (unlimited)    per process

 RLIMIT_NPROC:    (unlimited)       (unlimited)    per user

(dbx) quit
从上面的内容可以看到data属性的limit值为134217728 bytes即131072 kbytes与root的data(kbytes) 131072值完全吻合(stack的33554432 bytes即32768也与root的stack(kbytes) 32768一致),说明是通过监听建立连接进程的limit继承于root用户。
不通过监听进行连接:
$ SQLplus / as sysdba
SQL*Plus: Release 10.2.0.5.0 - Production on Mon Jul 20 17:16:09 2015
Copyright © 1982, 2010, Oracle. All Rights Reserved.
SQL> select * from v$mystat where rownum<2;
SID STATISTIC# VALUE
1375 0 1
SQL> select spid from vprocesswhereaddr=(selectpaddrfromvsession where sid=1375);
SPID
------------
47710432
跟踪这个服务器进程。
**$ dbx -a 47710432**

Waiting to attach to process 47710432 ...

Successfully attached to oracle.

warning: Directory containing oracle could not be determined.

Apply 'use' command to initialize source path.


Type 'help' for help.

reading symbolic information ...

stopped in read at 0x90000000002e294 ($t1)

0x90000000002e294 (read+0x274) e8410028     ld  r2,0x28(r1)

(dbx) proc rlimit

rlimit name:     rlimit_cur        rlimit_max    (units)

 RLIMIT_CPU:     (unlimited)       (unlimited)    sec

 RLIMIT_FSIZE:    (unlimited)       (unlimited)    bytes

 **RLIMIT_DATA:    (unlimited)       (unlimited)    bytes**

 RLIMIT_STACK:     33554432       4294967296    bytes

 RLIMIT_CORE:    (unlimited)       (unlimited)    bytes

 RLIMIT_RSS:     (unlimited)       (unlimited)    bytes

 RLIMIT_AS:     (unlimited)       (unlimited)    bytes

 RLIMIT_NOFILE:      65534       (unlimited)    descriptors

 RLIMIT_THREADS:   (unlimited)       (unlimited)    per process

 RLIMIT_NPROC:    (unlimited)       (unlimited)    per user

(dbx) quit

$
从上面的内容可以看到,如果不通过监听连接数据库创建的进程,它的data限制为unlimited的即无限制。
最后查看crs中监听的启动日志:(/u01/oracle/product/10.2.0/db_1/log/gisdata2/racg中的日志文件ora.gisdata2.LISTENER_GISDATA2.lsnr.log)。
2015-07-18 14:16:54.676: [  RACG][1] [28508196][1][ora.gisdata2.LISTENER_GISDATA2.lsnr]: The command completed successfully


**2015-07-18 14:47:09.078:** [  RACG][1] [29950132][1][ora.gisdata2.LISTENER_GISDATA2.lsnr]:

LSNRCTL for IBM/AIX RISC System/6000: Version 10.2.0.5.0 - Production on 18-JUL-2015 14:47:08


Copyright (c) 1991, 2010, Oracle. All rights reserved.

Starting /u01/oracle/product/10.2.0/db_1/bin/tnslsnr: please wait...

2015-07-18 14:47:09.079: [  RACG][1] [29950132][1][ora.gisdata2.LISTENER_GISDATA2.lsnr]: TNSLSNR for IBM/AIX RISC System/6000: Version 10.2.0.5.0 - Production

System parameter file is /u01/oracle/product/10.2.0/db_1/network/admin/listener.ora

Log messages written to /u01/oracle/product/10.2.0/db_1/network/log/listener_gisdata2.log


2015-07-18 14:47:09.079: [  RACG][1] [29950132][1][ora.gisdata2.LISTENER_GISDATA2.lsnr]: Listening on: (DESCRIPTION=(ADDRESS=(PROTOCOL=tcp)(HOST=10.176.30.81)(PORT=1521)))

Listening on: (DESCRIPTION=(ADDRESS=(PROTOCOL=tcp)(HOST=10.176.30.79)(PORT=1521)))

Listening on: (DESCRIPTION=(ADDRESS=(PROTOCOL=ipc)(KEY=EXTPROC)))
从以上的内容可以发现监听是由crs(或则是srvctl命令)启动的。
以及监听的运行时间:
$ lsnrctl status


LSNRCTL for IBM/AIX RISC System/6000: Version 10.2.0.5.0 - Production on 20-JUL-2015 16:31:03

Copyright (c) 1991, 2010, Oracle. All rights reserved.

Connecting to (ADDRESS=(PROTOCOL=tcp)(HOST=)(PORT=1521))

STATUS of the LISTENER

\------------------------

Alias           LISTENER_GISDATA2

Version          TNSLSNR for IBM/AIX RISC System/6000: Version 10.2.0.5.0 - Production

**Start Date        18-JUL-2015 14:56:39**

**Uptime          2 days 1 hr. 34 min. 24 sec**

Trace Level        off

Security          ON: Local OS Authentication

SNMP           ON

Listener Parameter File  /u01/oracle/product/10.2.0/db_1/network/admin/listener.ora

Listener Log File     /u01/oracle/product/10.2.0/db_1/network/log/listener_gisdata2.log
监听启动的时间也与日志中的时间对应。
11.3 解析原理的问题总结与建议
那为什么CRS会使用ROOT用户的limit限制呢?
首先,得明白在Linux中,每触发任何一个事件时,系统都会为它定义一个进程,并且给予一个ID,即PID,同时会根据触发这个进程的用户与相关属性关系,给这个PID设置有效的权限,如图11-1所示。
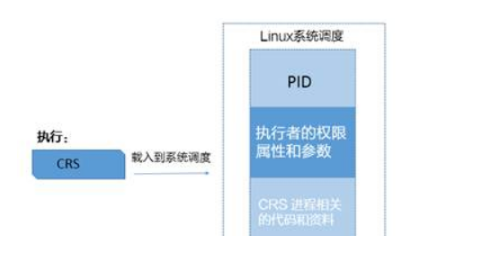
图11-1
从上面可以知道,系统启动以后,CRS会自动启动,启动主要由/etc/init.d的几个脚本完成。而这些脚本的执行用户和用户组是root,也就是说当CRS启动时,Linux系统会根据UID/GID来判断资源属性和环境变量,那么这个进程所衍生的进程,也会沿用这些属性。
由此可以得到结论,由于监听是通过crs进行的启动,继承了root用户的limit限制,每个会话所能持有的内存大小最大不能超过128M,当通过监听进行数据库连接时,由监听创建的用户进程也将继承该limit限制,所以当通过P/LSQL Developer连接数据库(包括SQL*Plus等工具需要通过监听建立用户进程的情况),在创建索引过程中,当所请求的内存达到或非常接近该限制时,就会由于无法进一步申请更多的内存资源,抛出ORA-04030错误。
提示,如果是在Linux系统中,可以通过cat /proc/PID/limits命令进行查看单个进程的limit属性值,其中PID为要查看进程的进程号。
以ORA-04030案例进行延伸扩展,为避免该错误可参考以下建议。
(1)在安装Oracle软件创建数据库之前应该对主机层面的内核参数、limit限制等进行规范的修改,以避免类似问题的发生。
(2)配置合理的内存,例如物理内存和交换空间。
(3)使用自动PGA内存管理可降低ORA-04030错误的概率。
