


matplotlib 画图示例
# -*- coding: utf-8 -*-
# File Name : page_font.py
# @Date : 2023/5/5 22:15
# - ***************-
from matplotlib import pyplot as plt
#字体设置
plt.rcParams['font.sans-serif'] = ['SimHei']
plt.rcParams['axes.unicode_minus'] = False
#x轴数值
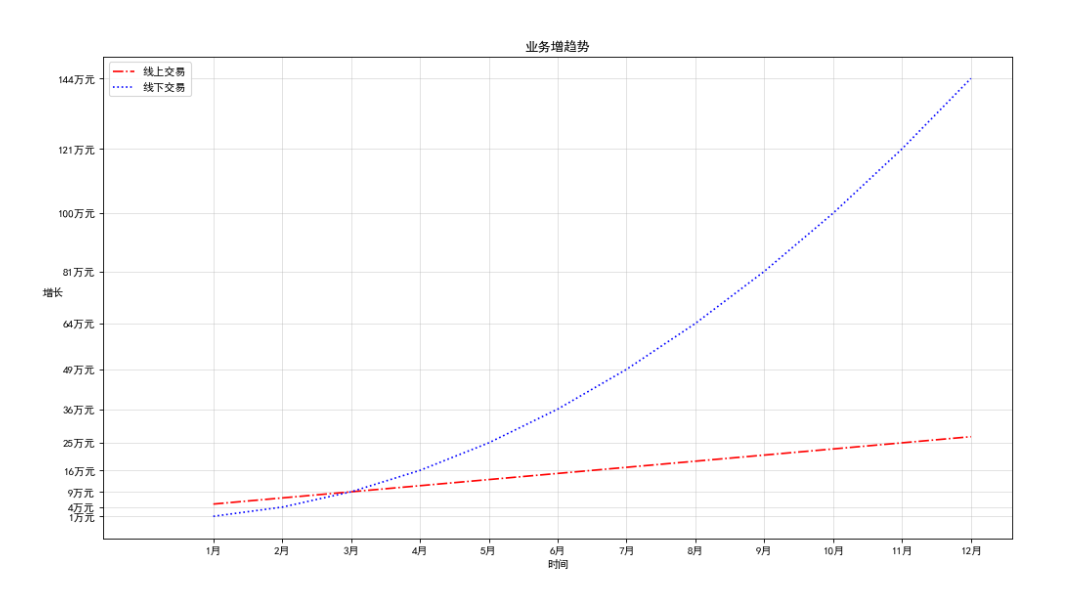
x = [i for i in range(1,13,1)]
#y轴数值
y = [i*2+3 for i in x]
#第二条折线y轴数值
_y = [i**2 for i in x]
#设置图形大小及分辨率
plt.figure(figsize=(15,8),dpi=80)
#绘制线1(红线)
plt.plot(x,y,color='r',linewidth=1.5,linestyle="-.",label='线上交易')
#绘制线2(蓝线)
plt.plot(x,_y,'b',1.5,linestyle=":",label='线下交易')
#设置x、y轴刻度
_xtick_labels = ["{}月".format(i) for i in x]
_ytick_labels = ["{}万元".format(i) for i in _y]
plt.xticks(x,_xtick_labels)
plt.yticks(_y,_ytick_labels)
#绘制网络
plt.grid(alpha=0.4) #alpha 透明度
#添加描述信息
plt.title("业务增趋势")
plt.xlabel('时间')
plt.ylabel('增长',rotation=0) #rotation 旋转度数
#添加图列
plt.legend(labels=['线上交易','线下交易'], loc='best')
#绘图后保存
plt.savefig("./t1.png")
plt.show()
查看支持字体
matplotlib默认不支持中文字符,因为默认的英文字体无法显示汉字
查看linux、mac下面支持的字体:
fc-list -> 查看支持的字体
fc-list:lang=zh ->查看支持的中文(冒号前面有空格)
from matplotlib import font_manager
#查看字体名以及对应的字体文件名
for font in font_manager.fontManager.ttflist:
    print(font.name,'_',font.fname)
SimHei _ C:\Windows\Fonts\simhei.ttf
Calisto MT _ C:\Windows\Fonts\CALIST.TTF
Nirmala UI _ C:\Windows\Fonts\NirmalaB.ttf
Verdana _ C:\Windows\Fonts\verdanaz.ttf
Consolas _ C:\Windows\Fonts\consolab.ttf
Century Gothic _ C:\Windows\Fonts\GOTHICI.TTF
Maiandra GD _ C:\Windows\Fonts\MAIAN.TTF
Segoe UI _ C:\Windows\Fonts\seguisb.ttf
…省略
其它图形命令:
柱形图:plt.bar(x,y,width=0.3)
横柱形图:plt.barh(x,y,heihgt=0.3)
散列图:plt.scatter(x,y)
直方图:
bin_width = 3 #设置组距为3
num_bins=int((max(a)-min(a))/bin_width) #分为多少组
plt.hist(a,num_bins)
最后修改时间:2023-05-06 21:04:46
「喜欢这篇文章,您的关注和赞赏是给作者最好的鼓励」
关注作者
【版权声明】本文为墨天轮用户原创内容,转载时必须标注文章的来源(墨天轮),文章链接,文章作者等基本信息,否则作者和墨天轮有权追究责任。如果您发现墨天轮中有涉嫌抄袭或者侵权的内容,欢迎发送邮件至:contact@modb.pro进行举报,并提供相关证据,一经查实,墨天轮将立刻删除相关内容。
