


1、原因
近期在生产环境遇到死锁情况,但show engine innodb status 只会显示两条语句,对排查死锁帮助很少。只有复原两个事务完整语句,才能更好的找到原因并解决死锁。
2、构造死锁现象
创建表与插入数据
create table lockt1(
id int,
num int,
primary key pk(id)
);
create table lockt2(
id int,
num int,
primary key pk(id)
);

create table lockt3(
id int,
num int,
primary key pk(id)
);

insert into lockt1
select 1,1 union all
select 2,2 union all
select 3,3 union all
select 4,4 union all
select 5,5 union all
select 6,6;

insert into lockt2
select 1,1 union all
select 2,2 union all
select 3,3 union all
select 4,4 union all
select 5,5 union all
select 6,6;

insert into lockt3
select 1,1 union all
select 2,2 union all
select 3,3 union all
select 4,4 union all
select 5,5 union all
select 6,6;
在SESSION1 执行
begin ;
update lockt1 set num = num +1 where id = 1;
update lockt2 set num = num +1 where id = 3;
在SESSION2执行
begin ;
update lockt3 set num = num +1 where id = 1;
update lockt2 set num = num +1 where id = 4;
回到SESSION1继续执行
update lockt3 set num = num +1 where id = 1;
此时SESSION1进入阻塞阶段。等待SESSION2 lockt3 id =1 的行释放锁
回到SESSION2继续执行
update lockt1 set num = num +1 where id = 1;
MySQL会自动死锁检测,回滚事务
查看死锁
show engine innodb status ;
LATEST DETECTED DEADLOCK
2023-05-09 20:49:33 0x1edc
*** (1) TRANSACTION:
TRANSACTION 33483, ACTIVE 18 sec starting index read
mysql tables in use 1, locked 1
LOCK WAIT 6 lock struct(s), heap size 1128, 3 row lock(s), undo log entries 2
MySQL thread id 35, OS thread handle 6328, query id 12279 localhost ::1 root updating
update lockt3 set num = num +1 where id = 1
*** (2) TRANSACTION:
TRANSACTION 33484, ACTIVE 12 sec starting index read
mysql tables in use 1, locked 1
LOCK WAIT 6 lock struct(s), heap size 1128, 3 row lock(s), undo log entries 2
MySQL thread id 37, OS thread handle 5560, query id 12281 localhost ::1 root updating
update lockt1 set num = num +1 where id = 1
*** WE ROLL BACK TRANSACTION (2)
我们看到了两个死锁的语句,且告知我们回滚了事务2
3、复原死锁语句
我们看到两个事务造成死锁的语句都有 query id,事务1的 query id = 12279 事务2的 query id = 12281
通过events_statements_history_long表 查询事务所在的thread_id
select thread_id,nesting_event_id,END_EVENT_ID,SQL_TEXT from PERFORMANCE_SCHEMA.events_statements_history_long where statement_id = 12279;
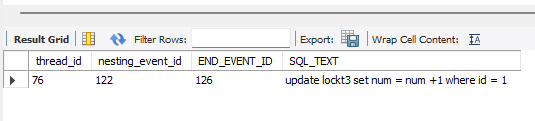
通过SQL_TEXT可以看到 与show engine innodb status 中的事务1语句一样。
我们关注3个字段 thread_id、nesting_event_id、END_EVENT_ID
通可下述语句可以复原整个事务1的语句
select SQL_TEXT from PERFORMANCE_SCHEMA.events_statements_history_long where thread_id = 76 and END_EVENT_ID  >=122  and END_EVENT_ID <=126
  order by END_EVENT_ID;
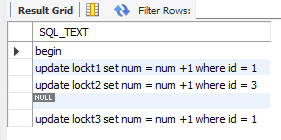
通过上图可以看到完整的复原了事务1的三条语句与执行顺序
同理,我们也可以复现事务2的完整语句与执行顺序
4、整理成模板,方便后面利用模板快速查询
模板语句1
set @statement_id = 12279; -- 此处填入事务1的query id
select @thread_id := thread_id,@begin_event_id := nesting_event_id,@END_EVENT_ID := END_EVENT_ID
from PERFORMANCE_SCHEMA.events_statements_history_long where statement_id = @statement_id;
select
  DATE_SUB(NOW(),INTERVAL (SELECT VARIABLE_VALUE FROM performance_schema.global_status WHERE VARIABLE_NAME='UPTIME') - timer_start*10e-13 second) as st_time
  ,sql_text
from PERFORMANCE_SCHEMA.events_statements_history_long where thread_id = @thread_id and END_EVENT_ID  >=@begin_event_id  and END_EVENT_ID <=@END_EVENT_ID;

 set @statement_id = 12281; -- 此处填入事务2的query id
select @thread_id := thread_id,@begin_event_id := nesting_event_id,@END_EVENT_ID := END_EVENT_ID
from PERFORMANCE_SCHEMA.events_statements_history_long where statement_id = @statement_id ;
 select
  DATE_SUB(NOW(),INTERVAL (SELECT VARIABLE_VALUE FROM performance_schema.global_status WHERE VARIABLE_NAME='UPTIME') - timer_start*10e-13 second) as st_time
  ,sql_text
from PERFORMANCE_SCHEMA.events_statements_history_long where thread_id = @thread_id and END_EVENT_ID  >=@begin_event_id  and END_EVENT_ID <=@END_EVENT_ID;
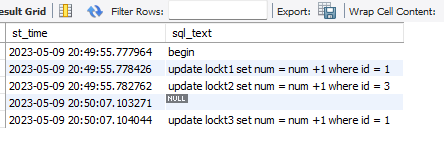
执行结果
事务一的完整语句及执行顺序
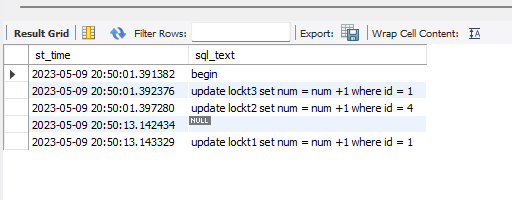
事务二的完整语句及执行顺序
模板语句2
set @statement1_id = 12279; -- 此处填入事务1的query id
set @statement2_id = 12281; -- 此处填入事务2的query id
  with cte1 as
  (
    select thread_id,nesting_event_id,END_EVENT_ID
     from PERFORMANCE_SCHEMA.events_statements_history_long where statement_id = @statement1_id
  )
  ,cte2 as
  (
    select thread_id,nesting_event_id,END_EVENT_ID
     from PERFORMANCE_SCHEMA.events_statements_history_long where statement_id = @statement2_id
  )
  ,
  cte3 as
  (
      select
	  thread_id,EVENT_ID, 1  as t ,statement_id,
      DATE_SUB(NOW(),INTERVAL (SELECT VARIABLE_VALUE FROM performance_schema.global_status WHERE VARIABLE_NAME='UPTIME') - timer_start*10e-13 second) as st_time ,sql_text
      from PERFORMANCE_SCHEMA.events_statements_history_long a where exists(select 1 from  cte1 b  where  a.thread_id = b.thread_id and a.END_EVENT_ID  >=b.nesting_event_id  and a.END_EVENT_ID <=b.END_EVENT_ID)
      union all
	  select
	  thread_id,EVENT_ID, 2  as t ,statement_id,
      DATE_SUB(NOW(),INTERVAL (SELECT VARIABLE_VALUE FROM performance_schema.global_status WHERE VARIABLE_NAME='UPTIME') - timer_start*10e-13 second) as st_time,sql_text
      from PERFORMANCE_SCHEMA.events_statements_history_long a where exists(select 1 from  cte2 b  where  a.thread_id = b.thread_id and a.END_EVENT_ID  >=b.nesting_event_id  and a.END_EVENT_ID <=b.END_EVENT_ID)
  )
  ,cte4 as
  (
    select a.st_time,case when b.statement_id = @statement1_id then concat(b.sql_text,'   Deadlock !!!') else  b.sql_text end as t1_s
    ,case when c.statement_id = @statement2_id then concat(c.sql_text,'   Deadlock !!!') else  c.sql_text end as t2_s
    from cte3  a
    left join  cte3 b on a.thread_id = b.thread_id and a.EVENT_ID = b.EVENT_ID and b.t = 1
    left join cte3 c on a.thread_id = c.thread_id and a.EVENT_ID = c.EVENT_ID and c.t = 2
  )
  select * from cte4 order by st_time;
运行结果
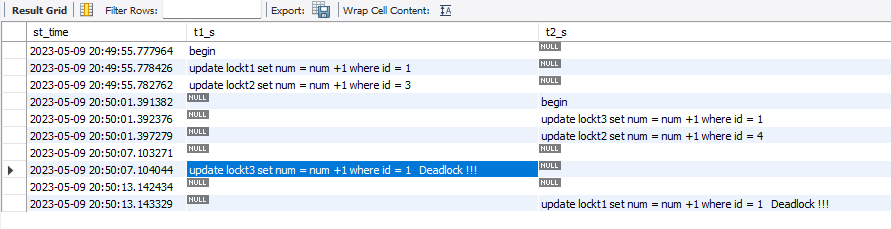
上述两种查找模板,选择一个自己喜欢的
我更喜欢模板2
我们根据完整语句,先后的执行顺序。很快就能找到死锁原因,并解决掉。
5、写事务要遵守2PL
上述死锁我们要避免简单。 两个事务遵守2PL 写出一致顺序的update语句,就可以避免死锁了。
后续再开一篇文章单独讲一下2PL
