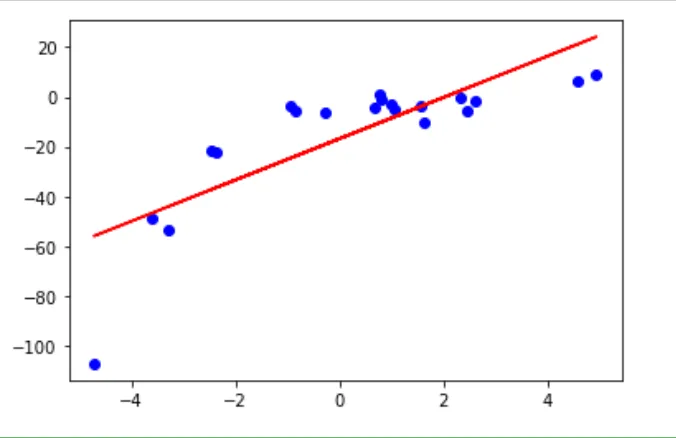
import numpy as np
import matplotlib.pyplot as plt

# Generate random data
np.random.seed(0)
x = 2 - 3 * np.random.normal(0, 1, 20)
y = x - 2 * (x ** 2) + 0.5 * (x ** 3) + np.random.normal(-3, 3, 20)

# Calculate the mean and standard deviation of x and y
x_mean = np.mean(x)
y_mean = np.mean(y)
x_std = np.std(x)
y_std = np.std(y)

# Calculate the coefficients of the linear regression equation
b1 = np.sum((x - x_mean) * (y - y_mean)) / np.sum((x - x_mean) ** 2)
b0 = y_mean - b1 * x_mean

# Plot the original data and the fitted simple linear regression
plt.scatter(x, y, color='blue')
plt.plot(x, b0 + b1 * x, color='red')
plt.show()
此代码将生成一个简单的线性回归模型,类似于使用scikit-learn 的模型。
以上代码的输出
使用 scikit-learn 创建分类模型
当然,这是在 Python 中使用scikit-learn构建分类模型的示例代码:
import numpy as np import pandas as pd from sklearn.model_selection import train_test_split from sklearn.ensemble import RandomForestClassifier from sklearn.metrics import accuracy_score
# Generating random data np.random.seed(0) data = np.random.randint(0,2,size=(100,3)) target = np.random.randint(0,2,size=(100,1))
# Converting data and target into dataframe data = pd.DataFrame(data, columns=['Feature 1', 'Feature 2', 'Feature 3']) target = pd.DataFrame(target, columns=['Target'])
# Splitting data into training and testing set X_train, X_test, y_train, y_test = train_test_split(data, target, test_size=0.2, random_state=0)
# Building and training the classifier clf = RandomForestClassifier(n_estimators=100, random_state=0) y_train = y_train.values.ravel() clf.fit(X_train, y_train)
# Making predictions on test data y_pred = clf.predict(X_test)