


本期主要介绍如何利用BaseR以及ggplot2[1]绘制饼图。
1、数据准备
使用ggplot2中diamonds数据集。
library(tidyverse)

color_df <- diamonds %>% group_by(color) %>% tally() %>%
  mutate(prop = round((n/sum(n)) * 100 , digits = 2))
color_df
#  color     n  prop
#  <ord> <int> <dbl>
#1 D      6775 12.6
#2 E      9797 18.2
#3 F      9542 17.7
#4 G     11292 20.9
#5 H      8304 15.4
#6 I      5422 10.0
#7 J      2808  5.21
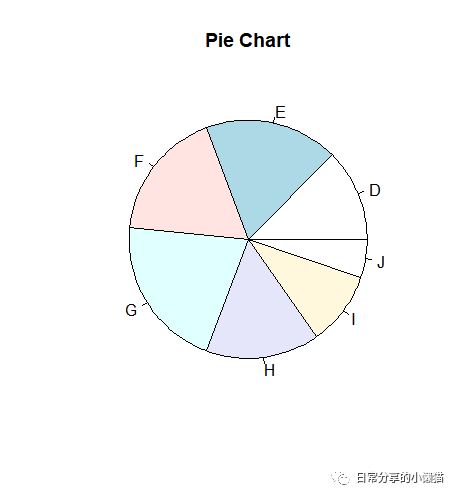
2、BaseR绘制
pie(x = color_df$n, labels = color_df$color, main = "Pie Chart")
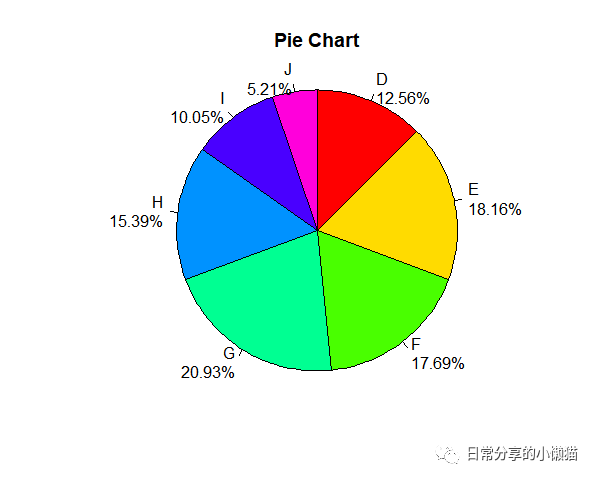
进一步填充颜色,标签本文等。
pie(x = color_df$n,
    labels = paste(color_df$color,"\n",color_df$prop, "%", sep=""),
    cex = 1,radius = 1, clockwise = TRUE, col = rainbow(7), main = "Pie Chart")
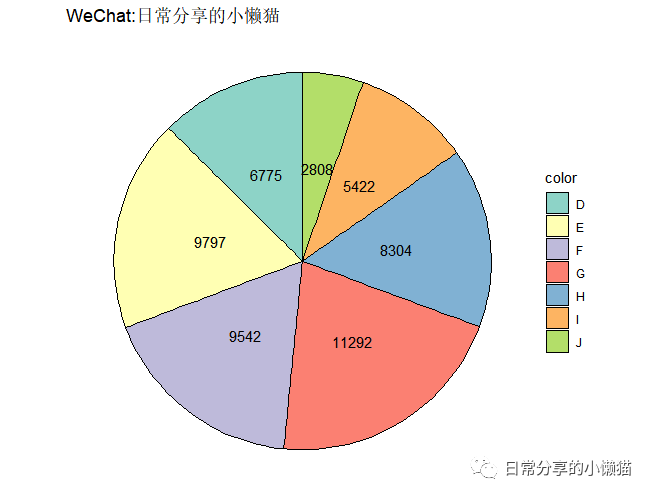
3、ggplot2绘制
3.1 饼图绘制
ggplot(color_df, aes(x = "", y = n, fill = color)) +
  geom_col(color = "black") +
  #geom_bar(stat = "identity", width = 1) +
  geom_text(aes(label = n), position = position_stack(vjust = 0.5), size = 4) +
  scale_fill_brewer(palette = "Set3") +
  coord_polar("y", start = 0)  +
  theme_void()
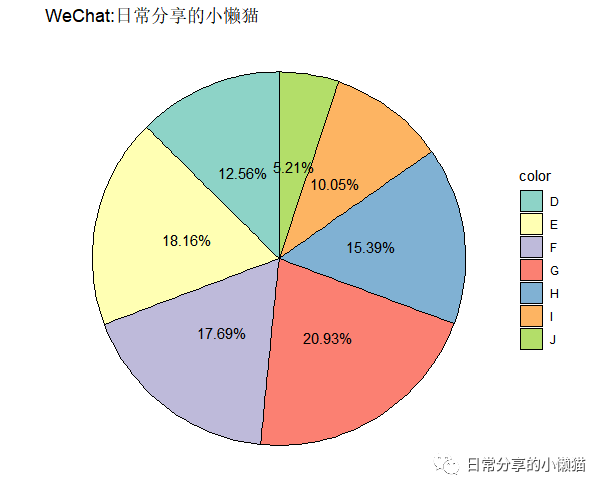
3.2 百分比形式
将频次标签修改为百分比标签。
ggplot(color_df, aes(x = "", y = n, fill = color)) +
  geom_col(color = "black") +
  #geom_bar(stat = "identity", width = 1) +
  geom_text(aes(label = paste0(prop, "%")), position = position_stack(vjust = 0.5), size = 4) +
  scale_fill_brewer(palette = "Set3") +
  coord_polar("y", start = 0)  +
  theme_void()
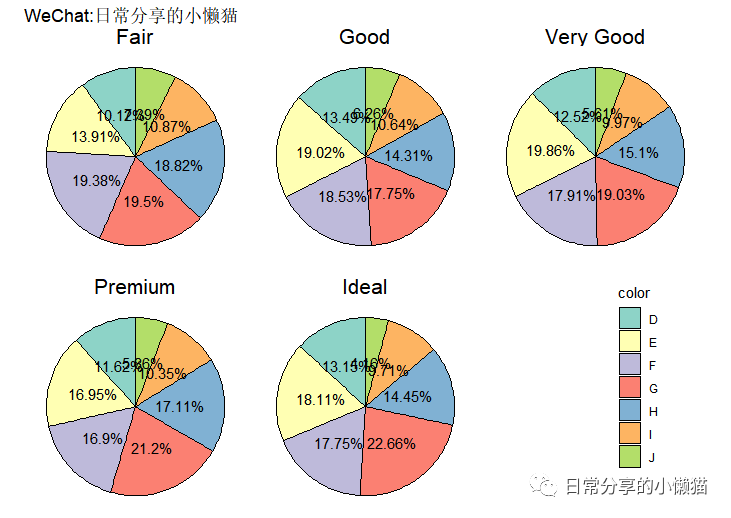
3.3 分面形式
绘制分面形式的饼图。
diamonds_df <- diamonds %>% group_by(cut, color) %>% tally() %>%
  mutate(prop = round((n/sum(n)) * 100 , digits = 2)) %>% ungroup()
head(diamonds_df)

#  cut   color     n  prop
#  <ord> <ord> <int> <dbl>
#1 Fair  D       163  10.1
#2 Fair  E       224  13.9
#3 Fair  F       312  19.4
#4 Fair  G       314  19.5
#5 Fair  H       303  18.8
#6 Fair  I       175  10.9

# plot
ggplot(diamonds_df, aes(x = "", y = prop, fill = color)) +
  geom_col(color = "black") +
  #geom_bar(stat = "identity", width = 1) +
  geom_text(aes(label = paste0(prop, "%")), position = position_stack(vjust = 0.5), size = 4) +
  scale_fill_brewer(palette = "Set3") +
  coord_polar("y", start = 0)  +
  facet_wrap(~cut) +
  theme_void() +
  theme(strip.text = element_text(size = 16),
        legend.position = c(0.9, 0.3))
4、其他
更多内容可关注微信公众号日常分享的小懒猫
。
如有帮助请多多点赞哦!
参考资料
ggplot2: https://cran.r-project.org/web/packages/ggplot2/index.html
文章转载自日常分享的小懒猫,如果涉嫌侵权,请发送邮件至:contact@modb.pro进行举报,并提供相关证据,一经查实,墨天轮将立刻删除相关内容。
