


误差线图用于展示数据的不确定性程度,样本数据的波动是通过标准差体现,因而样本均值不确定性程度为标准差[1]。本文主要展示如何利用ggplot2绘制带误差线的条形图,展示样本均值的偏离程度。如下图所示: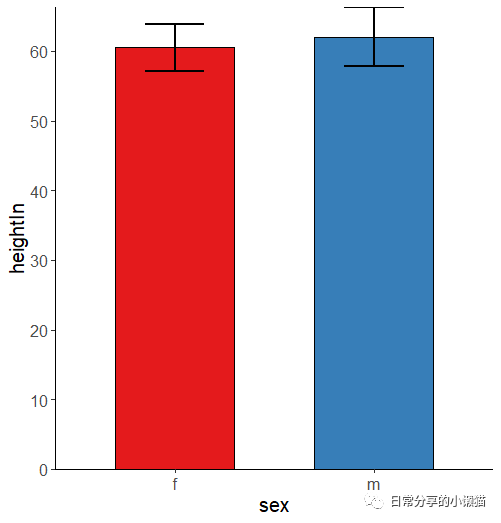
1、绘图准备
利用gcookbook包中的heightweight数据集,绘制男生和女生身高(英寸
)均值的柱状图,并添加误差线,即表示身高均值±标准差。
library(ggplot2)
library(gcookbook)
library(dplyr)
head(heightweight)
#  sex ageYear ageMonth heightIn weightLb
#1   f   11.92      143     56.3     85.0
#2   f   12.92      155     62.3    105.0
#3   f   12.75      153     63.3    108.0
#4   f   13.42      161     59.0     92.0
#5   f   15.92      191     62.5    112.5
#6   f   14.25      171     62.5    112.0
2、图形绘制
2.1 柱状图与加入误差线
#柱状图
ggplot(heightweight, aes(sex, heightIn, fill = sex)) +
  stat_summary(geom = "bar", fun = mean, width = 0.6, color = "black")

#加入误差线
ggplot(heightweight, aes(sex, heightIn, fill = sex)) +
  stat_summary(geom = "bar", fun = mean, width = 0.6, color = "black") +
  stat_summary(geom = "errorbar", fun.args = list(mult = 1), fun.data = mean_sdl, width = 0.3, size = 1) +
  scale_y_continuous(breaks = seq(0, 70, 10),expand = c(0, 0)) +
  scale_fill_brewer(palette = "Set1") +
  theme_classic()
# 第一个stat_summary为柱状图,第二个为加入误差线,mean_sdl表示均值±标准差,mult = 1表示加减1个标准差。
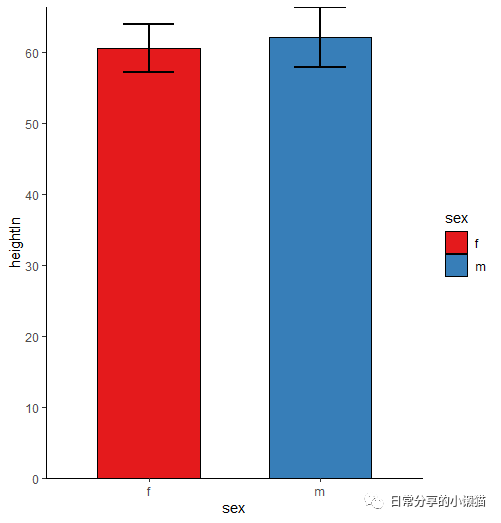
2.2 去除图例
ggplot(heightweight, aes(sex, heightIn, fill = sex)) +
  stat_summary(geom = "bar", fun = mean, width = 0.6, color = "black") +
  stat_summary(geom = "errorbar", fun.args = list(mult = 1), fun.data = mean_sdl, width = 0.3, size = 1) +
  scale_y_continuous(breaks = seq(0, 70, 10),expand = c(0, 0)) +
  scale_fill_brewer(palette = "Set1") +
  theme_classic() +
  theme(legend.position = "none",
        axis.title = element_text(size = 15),
        axis.text = element_text(size = 12))
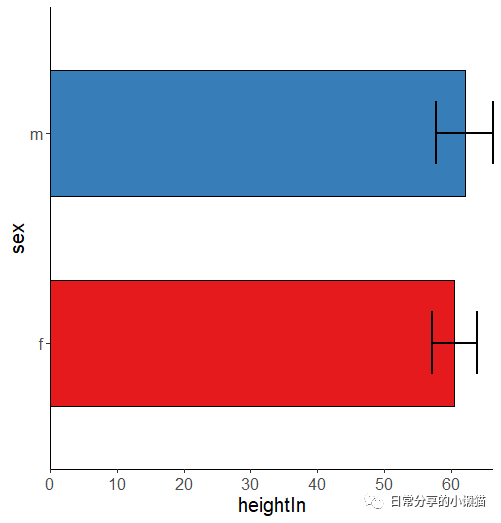
2.3 反转x轴和y轴
ggplot(heightweight, aes(sex, heightIn, fill = sex)) +
  stat_summary(geom = "bar", fun = mean, width = 0.6, color = "black") +
  stat_summary(geom = "errorbar", fun.args = list(mult = 1), fun.data = mean_sdl, width = 0.3, size = 1) +
  scale_y_continuous(breaks = seq(0, 70, 10),expand = c(0, 0)) +
  scale_fill_brewer(palette = "Set1") +
  theme_classic() +
  theme(legend.position = "none",
        axis.title = element_text(size = 15),
        axis.text = element_text(size = 12)) +
  coord_flip()
2.4 计算均值与标准差
heightweight %>% group_by(sex) %>% summarise(mean = mean(heightIn)) #均值
#  sex    mean
#1 f      60.5
#2 m      62.1
heightweight %>% group_by(sex) %>% summarise(sd = sd(heightIn)) #标准差
#  sex      sd
#1 f      3.36
#2 m      4.27
3、其他
关于条形图的绘制可进一步阅读R语言绘图|条形图绘制。其他绘图方法可进一步阅读公众号其他文章。
如有帮助请多多点赞哦!
参考资料
误差线图: https://spssau.com/helps/visualization/error.html
文章转载自日常分享的小懒猫,如果涉嫌侵权,请发送邮件至:contact@modb.pro进行举报,并提供相关证据,一经查实,墨天轮将立刻删除相关内容。
