


大家好,我是小寒~
什么是异常值
异常值的影响
在统计学中,有三种集中趋势的度量,分别是均值、中位数和众数。
当数据集不存在任何异常值时,均值是「描述数据的准确度量」。
「如果数据集中存在异常值,则使用中值。」
如果存在异常值且大于总数的 1/2 或 更多数据是相同值时,则使用众数。
「“均值” 是唯一受异常值影响」的集中趋势的度量,异常值又会影响标准差。
例如
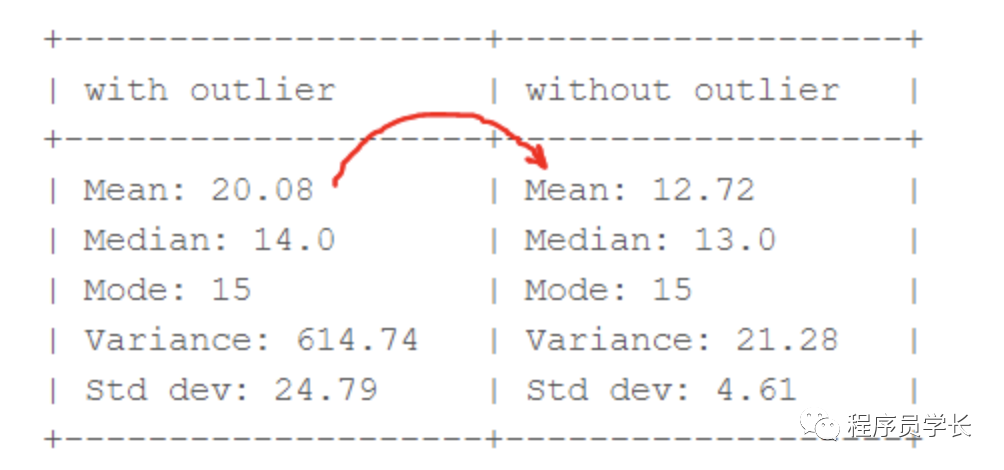
从上图中,我们可以清楚地看出「均值比中值受异常值的影响更大。」
异常值检测
以下是一些常用的异常值检测技术。
箱线图 Z-score 分位数间距(IQR)
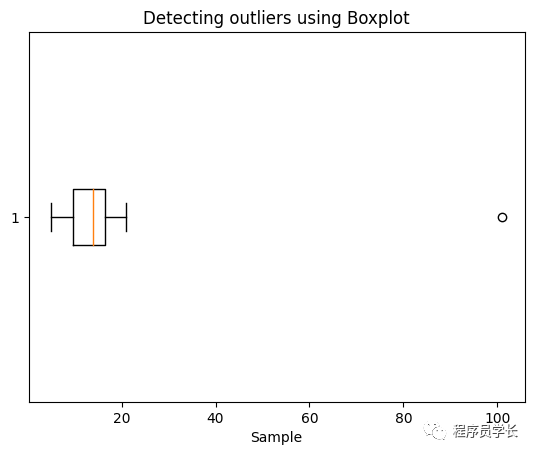
1、使用箱线图进行异常值检测:
import matplotlib.pyplot as plt

sample= [15, 101, 18, 7, 13, 16, 11, 21, 5, 15, 10, 9]
plt.boxplot(sample, vert=False)
plt.title("Detecting outliers using Boxplot")
plt.xlabel('Sample')
plt.show()
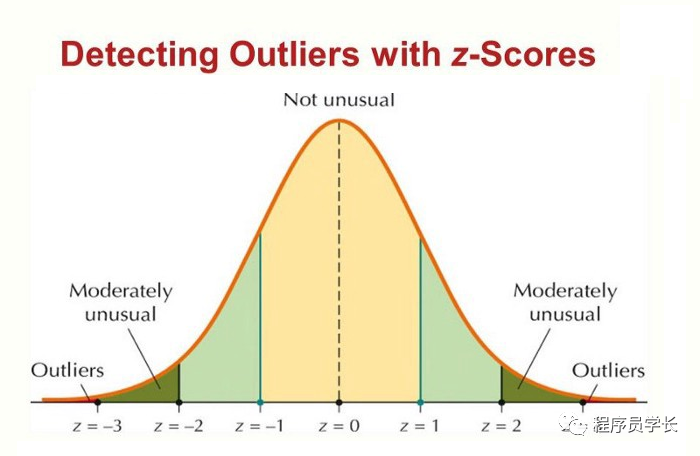
2、使用 Z-score 检测异常值
步骤:
遍历所有数据点并使用公式 (X-mean)/std 计算 Z-score。
定义阈值为 3,将 Z-score 绝对值大于阈值的数据点标记为异常值。
import numpy as np
outliers = []
def detect_outliers_zscore(data):
    thres = 3
    mean = np.mean(data)
    std = np.std(data)
    # print(mean, std)
    for i in data:
        z_score = (i-mean)/std
        if (np.abs(z_score) > thres):
            outliers.append(i)
    return outliers# Driver code
sample_outliers = detect_outliers_zscore(sample)
print("Outliers from Z-scores method: ", sample_outliers)
输出:
Outliers from Z-scores method: [101]
3、使用分位数间距 (IQR) 检测异常值
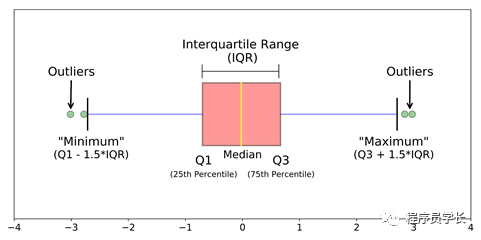
「位于 Q3 上方和 Q1 下方 1.5 倍 IQR 的数据点是异常值。」
步骤:
对数据集进行升序排列 计算第一和第三四分位数 (Q1, Q3) 计算 IQR = Q3 - Q1 计算下限 = (Q1–1.5 * IQR),上限 = (Q3+1.5 * IQR) 遍历数据集的值并检查那些低于下限和高于上限的值,并将它们标记为异常值。
outliers = []
def detect_outliers_iqr(data):
    data = sorted(data)
    q1 = np.percentile(data, 25)
    q3 = np.percentile(data, 75)
    # print(q1, q3)
    IQR = q3-q1
    lwr_bound = q1-(1.5*IQR)
    upr_bound = q3+(1.5*IQR)
    # print(lwr_bound, upr_bound)
    for i in data:
        if (i<lwr_bound or i>upr_bound):
            outliers.append(i)
    return outliers# Driver code
sample_outliers = detect_outliers_iqr(sample)
print("Outliers from IQR method: ", sample_outliers)
输出:
Outliers from IQR method: [101]
处理异常值
常用的异常值处理方法如下。
删除异常值 基于分位数的剪枝 平均数/中位数插补
1、删除异常值
for i in sample_outliers:
    a = np.delete(sample, np.where(sample==i))
print(a)
输出:
[15 18 7 13 16 11 21 5 15 10 9]
2、基于分位数的剪枝
# Computing 10th, 90th percentiles
tenth_percentile = np.percentile(sample, 10)
ninetieth_percentile = np.percentile(sample, 90)
print(tenth_percentile, ninetieth_percentile)

#replacing the outliers
b = np.where(sample<tenth_percentile, tenth_percentile, sample)
b = np.where(b>ninetieth_percentile, ninetieth_percentile, b)
print("Sample:", sample)
print("New array:",b)
输出为
7.2 20.7
Sample: [ 15 101  18   7  13  16  11  21   5  15  10   9]
New array: [15.  20.7 18.   7.2 13.  16.  11.  20.7  7.2 15.  10.   9. ]
小于第 10 个百分位数的数据点将替换为第 10 个百分位数的值,大于第 90 个百分位数的数据点将替换为第 90 个百分位数的值。
3、平均数/中位数插补
median = np.median(sample)
print(median)
for i in sample_outliers:
    c = np.where(sample==i, median, sample)
print("Sample: ", sample)
print("New array: ",c)
输出:
14.0
Sample: [ 15 101 18 7 13 16 11 21 5 15 10 9]
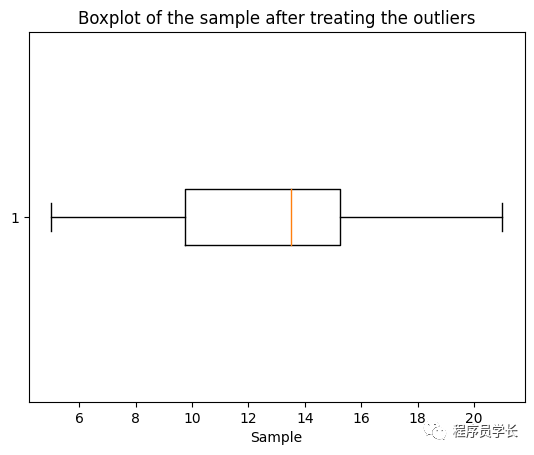
New array: [15. 14. 18. 7. 13. 16. 11. 21. 5. 15. 10. 9.]
plt.boxplot(c, vert=False)
plt.title("Boxplot of the sample after treating the outliers")
plt.xlabel("Sample")
最后
—
「进群方式:加我微信,备注 “python”」

往期回顾

如果对本文有疑问可以加作者微信直接交流。进技术交流群的可以拉你进群。

文章转载自程序员学长,如果涉嫌侵权,请发送邮件至:contact@modb.pro进行举报,并提供相关证据,一经查实,墨天轮将立刻删除相关内容。
