


之前文章介绍了在vue页面内嵌三方监控展示页面grafana,看到里面有主机相关的详细监控信息,有的开发朋友比较感兴趣,问我如何搭建,我这边就介绍一番。
首先简单了解下,prometheus和grafana:
Prometheus是一款开源的监控和报警工具,可以收集和处理时序列数据,常用于监控分布式系统和服务,有自己的promql查询语言。K8s搭配prometheus的组合在企业还是很流行的。
Grafana也是一个开源的数据可视化工具,以查询Prometheus的数据并创建漂亮的监控面板和图表。Prometheus作为数据源,在Grafana中添加Prometheus数据源,就可以创建显示来自Prometheus的metrics数据了。
具体的特性功能大家可以直接上官网查阅,后期我会单独再详细介绍,今天就只说如何搭建。
安装prometheus
我这边没有用yum仓库源,因为我使用的时候,网络问题导致下载比较慢,所以直接将二进制包下载下来,运行即可。
wget https://github.com/prometheus/prometheus/releases/download/v*/prometheus-*.*-amd64.tar.gztar xvf prometheus-*.*-amd64.tar.gzcd prometheus-*.*
修改target ip,在prometheus.yaml中配置
启动程序
./prometheus --config.file=./prometheus.yml
访问web页面
http://ip:9090/targets?search=

安装node节点基础信息监控
https://prometheus.io/docs/guides/node-exporter/
下载最新版安装包,解压并安装
wget https://github.com/prometheus/node_exporter/releases/download/v*/node_exporter-*.*-amd64.tar.gztar xvfz node_exporter-*.*-amd64.tar.gzcd node_exporter-*.*-amd64./node_exporter
默认监控端口为9100,如果被占用
可以改为其他端口如下:
./node_exporter --web.listen-address=:9200
修改Prometheus.yml配置文件node_exporter的scrape_config,将targets中的9100端口改为9200端口:
ymlscrape_configs:-job_name: 'node'static_configs:-targets: ['localhost:9200'] # 这里改为9200端口
搭建grfana
官网
https://grafana.com/grafana/download
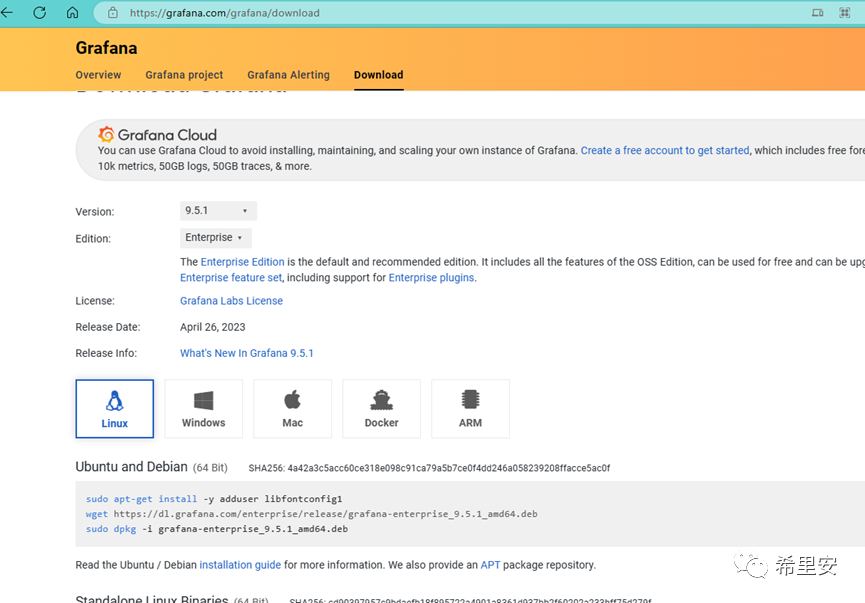

Wget https://dl.grafana.com/oss/release/grafana-9.5.1-1.x86_64.rpmsudo yum install -y https://dl.grafana.com/oss/release/grafana-9.5.1-1.x86_64.rpm
https://grafana.com/docs/grafana/latest/setup-grafana/installation/redhat-rhel-fedora/systemctl start Grafana-serverhttps://grafana.com/docs/grafana/latest/setup-grafana/start-restart-grafana/To start the service, run the following commands:sudo systemctl daemon-reloadsudo systemctl start grafana-serversudo systemctl status grafana-serverTo verify that the service is running, run the following command:sudo systemctl status grafana-serverConfigure the Grafana server to start at boot using systemdTo configure the Grafana server to start at boot, run the following command:
sudo systemctl enable grafana-server.service
/etc/grfana/default.ini
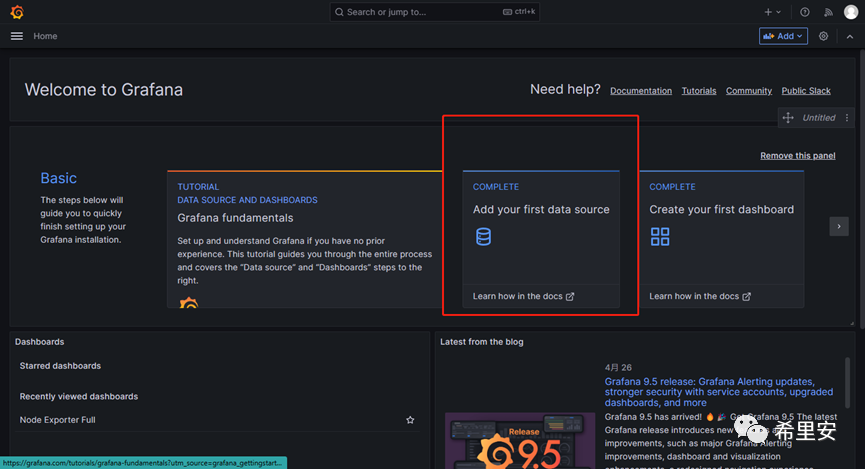
引入数据源
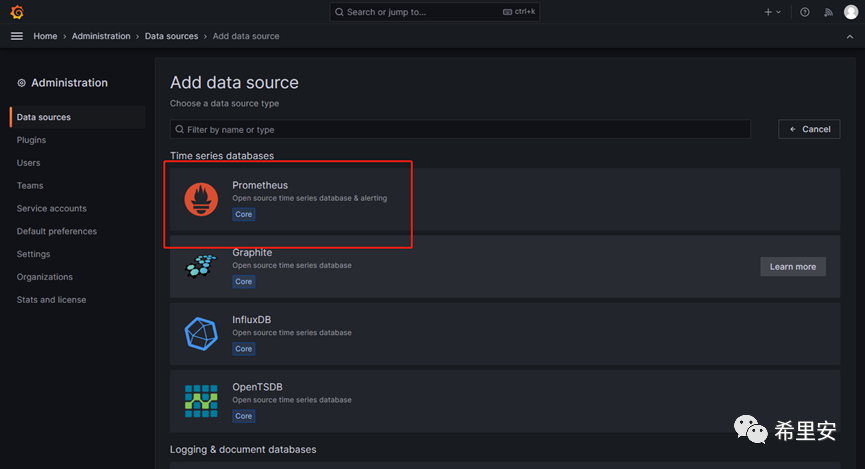
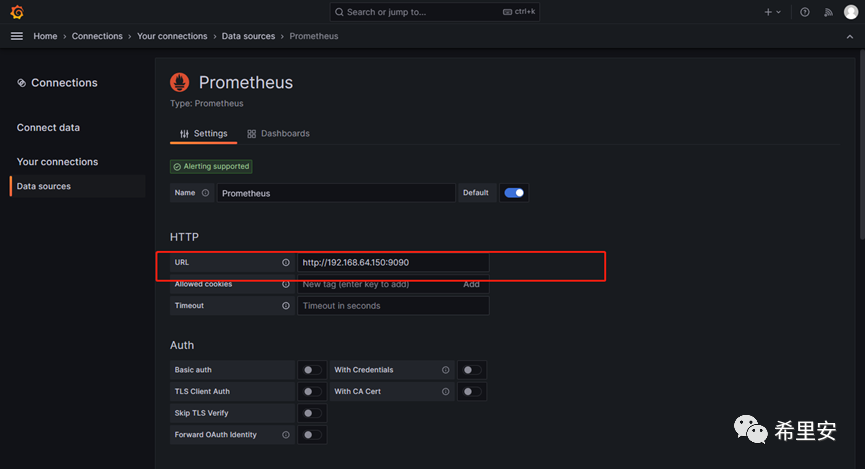
填入prometheus数据源
locahost要改成实际的ip:9090
引入Grafana面板
https://grafana.com/grafana/dashboards/1860-node-exporter-full/
看板搭建:

到此,prrometheus+Grafana监控基础信息的看板已经搭建完成,还是很简单的,快去试试吧,今天的分享就到这了,感兴趣的朋友记得关注点赞呀!

文章转载自希里安,如果涉嫌侵权,请发送邮件至:contact@modb.pro进行举报,并提供相关证据,一经查实,墨天轮将立刻删除相关内容。
